
Three Ways Terminal AI Has Changed How I Work (And Whether It's Coming for My Job)
How terminal AI compresses setup, robustness checks, and iteration without replacing judgment, and whether Olivia Rodrigo caused the inflation wave.

There’s been a lot of buzz about terminal-based AI tools like Claude Code and OpenAI’s Codex. Unlike the browser chat interfaces most people use, these tools run locally on your computer and they’ve gained serious traction over the past several months.
But much of the discussion has been caught between people building applications as fun personal hobbies on one end, and massive enterprise software on the other. Most of us who use these professionally will live somewhere in the middle. (The discourse is also wedged against whether AI will cause large-scale unemployment or otherwise destabilize society.)
I’ve integrated these terminal tools into my workflow over the past two months. Below are three specific ways I’m using them that are genuinely new, and where I’m not going back to how I worked before. Terminal AI compresses the setup and robustness-checking phase of knowledge work. I’ll also explain what makes them different from the browser-based chat tools, and whether I, Mike Konczal, am about to be automated out of a job. My relevant background is in a footnote here.1 This is not a setup guide, though I’ll try to explain ways these examples might be applicable to you. That will be helpful, as these tools are not going away.
Use 1: Real-Time Analysis, Without the Prep Work
I maintain a set of R files, the statistical programming language, for instant analysis of the economic data releases. Those numbers generally come out at 8:30 a.m. several times a month, and by 8:35 a.m. I need to know the big takeaways.
I’m not trading on this information, so I don’t need to know within milliseconds. But I do make statements that other political actors use, and accuracy is vital. For instance, I was interviewed by the New York Times shortly after the jobs numbers last week, and I want to be able to say something useful, interesting, and, most important, true.
My old workflow was that I’d take one or two hours the day before the major monthly data releases and manually code a few new graphics based on what I expected would be important. Maybe I post them or maybe I don’t, but they help me keep track of how the economy is moving, and they force me to think of new pieces I may have been missing.
Now I just ask Code/Codex to write them. It’s usually 95% of the way there on the first go. I check the math and get it fully there with one or two more exchanges.
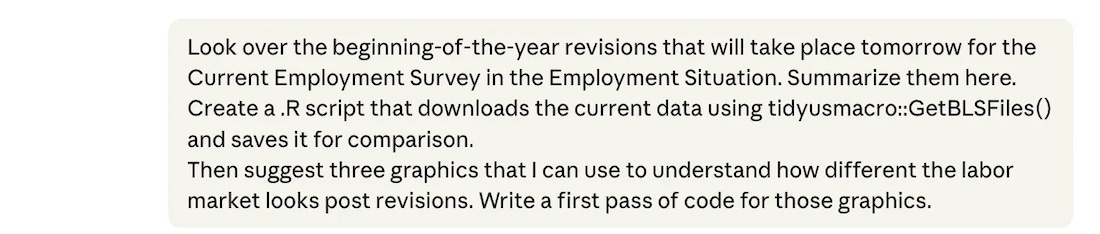
What used to be 4–5 hours of work in an average month is now 15 minutes. The reduction in time allows me to ask even more questions and prepare more materials. I have a lot of experience in this, so I’m able to proofread the code and I double-check that it is doing what I want it to do.
Why not just use the Claude or ChatGPT webpage for this? I used to do this. But there is significant copy-and-paste overhead. The old way meant copying code out of the browser, pasting it, running it, copying any error messages or changes that needed to be made back into the chat, and repeating. With the terminal tool, the LLM writes the code and runs it in the same folder. It can see whether what it did worked, investigate failures on its own, and I see the result after every pass without touching a clipboard.
Why not just let the AI find the interesting result? The LLM actually does a poor job of this, as it lacks the context for what people are searching for or what stands out. It can summarize news reporting on those numbers after they circulate, but influencing that coverage is the point of the exercise.
So if your job involves monitoring something that changes on a schedule, such as earnings releases, polling averages, clinical trial updates, or monthly sales figures, and you currently spend the hours before and after each release manually refreshing Excel models or rerunning Tableau dashboards, this is the use case that will feel most immediately different. The tool doesn't just help you go faster. It makes it cheap to add new angles of analysis instead of being locked into what you could cover in limited prep time.
Use 2: Building Out a Report
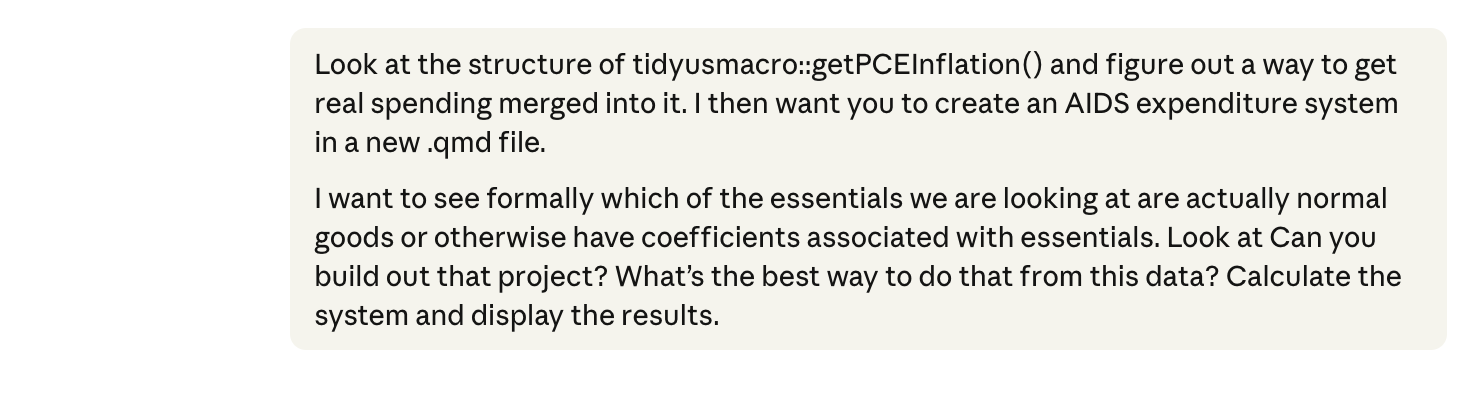
Last Monday, I published a blog post about the affordability crisis. Check it out! Near the beginning are three graphics I made on the price, spending, and indexing of essential items. To do this I created a folder on my desktop and dropped in the relevant data files. Then I gave this opening prompt:
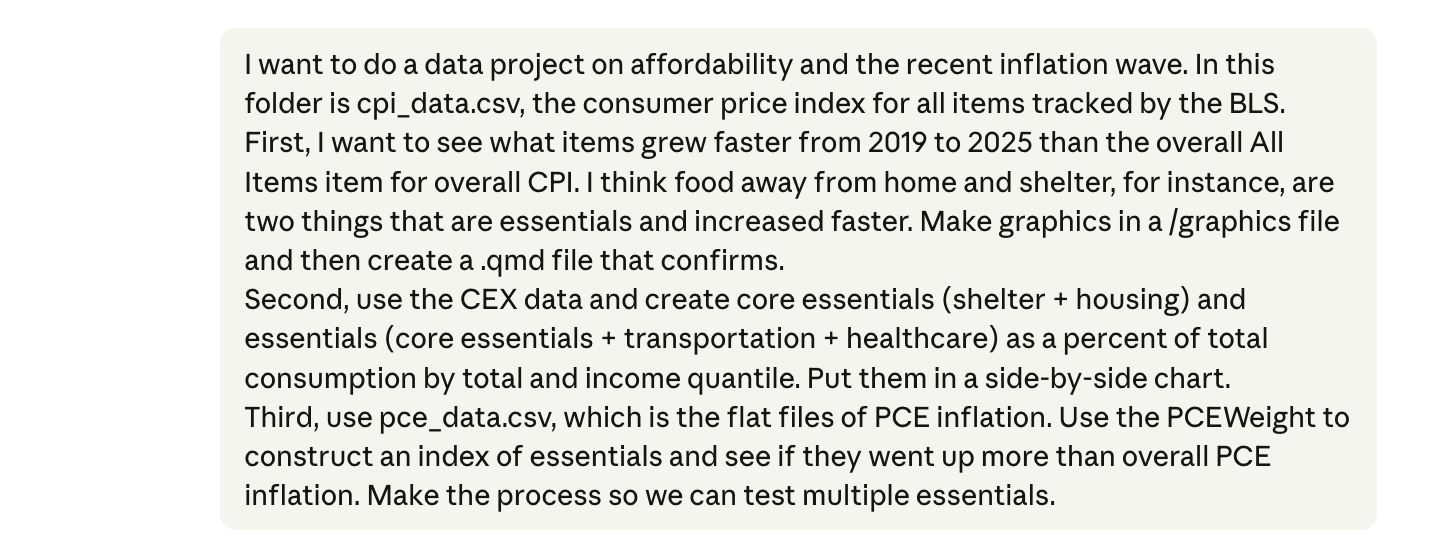
Note I ask it to create a qmd file (Quarto Markdown), which can render to html, pdf, or slides with minimal changes. You’ll probably be using a similar method in the future.
It got very close on the first pass. I scanned the code to check the methodology, spot-checked one item from each by manually calculating it (knowing the algorithm means that if one is correct, all of them are).
From there the prompts are mostly about cleaning up:
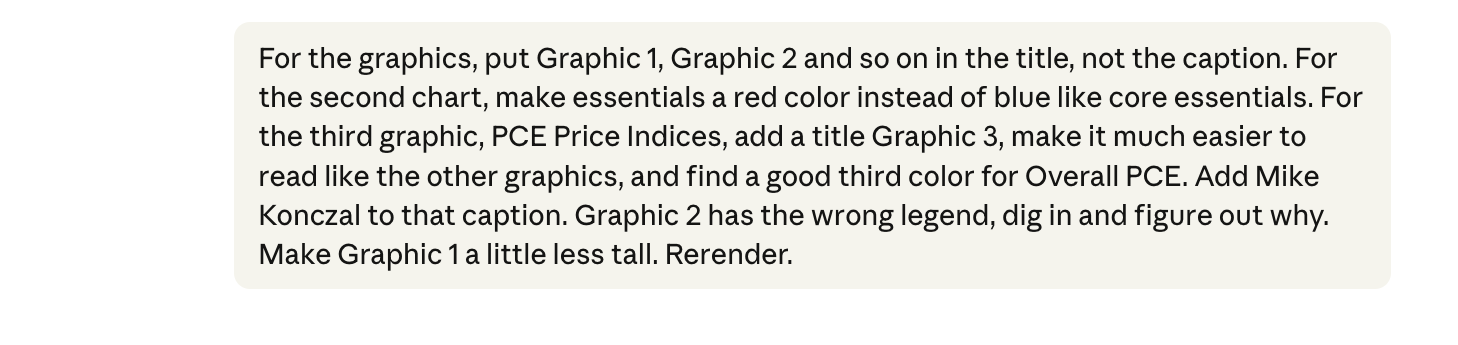
I’m just talking into the microphone at this point, deciding which essentials to include (some categories overlap in ways the LLM wouldn’t know) while simultaneously tweaking colors, legends, titles, and sizing, while it re-renders the graphic.
One thing I worry about is that if I’m not mucking around with the data myself, I’ll miss important side observations. But even in this pass I notice things: cigarettes show a huge price increase (it’s very funny that the LLM thought cigarettes are an essential), and I wonder if it’s driven by excise taxes, the same way tariffs are mechanically increasing the price of goods in 2025 and 2026. Something to investigate.
A benefit here is that stress-testing became trivial. Want to check whether your finding holds under a different index, or a different date range? If you are using Excel this is a nightmare, and even with statistical programming it’s a slog. But I get this done in a minute and can be more confident my results will hold under scrutiny.
Doing this part of my blog post last week would previously have taken 1-2 hours, with an additional 1-2 hours if I wanted to stress-test the indexes to make sure the results are robust. It took me 15 minutes to do this here.
So any future project that involves empirical work will be built out of a folder where the terminal LLM is executing work that I check. The terminal allows it to do much more complicated work, faster.
So if your job requires you to produce regular analytical reports, for clients, for leadership, or for publication, you will use this to cut out difficult first steps. Often the bottleneck is not the writing, it’s getting from raw, unorganized data to a defensible visual that you trust and can defend. The terminal tools compress that step dramatically, and more importantly, they make it cheap to check whether your finding survives different methodological choices. That robustness-checking step is the one most people skip under deadline pressure. Now you don’t have to.
You Bought a New Car and Auto Inflation’s Really Taken Off
I really want to emphasize how much of the work for any report is this basic setup, the data-wrangling and first-pass results to see if the results are worth exploring in full. This can be time-consuming, especially if it doesn’t pan out. Unless you try it, I can’t describe to you how fast the terminal LLM can get through this stage, and keeps the building blocks in place to iterate on.
Two examples I explored recently. There’s an interesting new paper from Louie, Mondragon, and Wieland on whether supply constraints actually explain house price and quantity growth across U.S. cities. I wanted to get into the guts of the paper before I formed an opinion and wrote about it in the future here. But the actual data, merged across multiple datasets of prices, quantities, and restrictions, all from different sources, each with its own formatting and naming conventions for local areas, is a nightmare.
I put the data in a folder with the paper and had the tool merge it all in a single 10-minute session. It closely reproduced their key graphic, giving me a foundation to explore their work more fully. (I was told by one of the authors that the research assistant who led that data merging had a lot of big feelings about this.) Data merging in the browser tool, by contrast, had never worked reliably for me; but being able to iterate in place, with the LLM reacting to exactly what went wrong and adjusting, got it done.
Or take the standard “Phillips curve” style analysis of inflation. From around 2022-2023, a lot of people were running these regressions adding variables that followed the timing of inflation, like global supply chain stress metrics or the vacancies-to-unemployment ratio. I was frustrated because those don’t predict inflation out-of-sample and basically anything with an up-and-down pattern during those years would “predict” inflation.
Back then I had some code that estimated inflation with those variables along with other things that just happened to pop in 2021-2022. First, a dummy variable with a value of 1 in 2021-2022 and 0 every other year. Second YouTube views for Olivia Rodrigo’s “good 4 u” video, which debuted in May 2021, just like the inflation spike. What would be the best predictor of inflation?
I never got around to finishing it all at the time. But then James Stock and Mark Watson, the godfathers of empirical macro, published a paper in late 2025 finding that basically only COVID deaths explain the inflation in a component analysis. It’s a big victory for the cost-push shock side of the inflation debate. We should do a full post on it, as the entire episode traces back to a single supply-side shock. That made me want to dig my idea back out.
Sure enough, Codex one-shotted it.
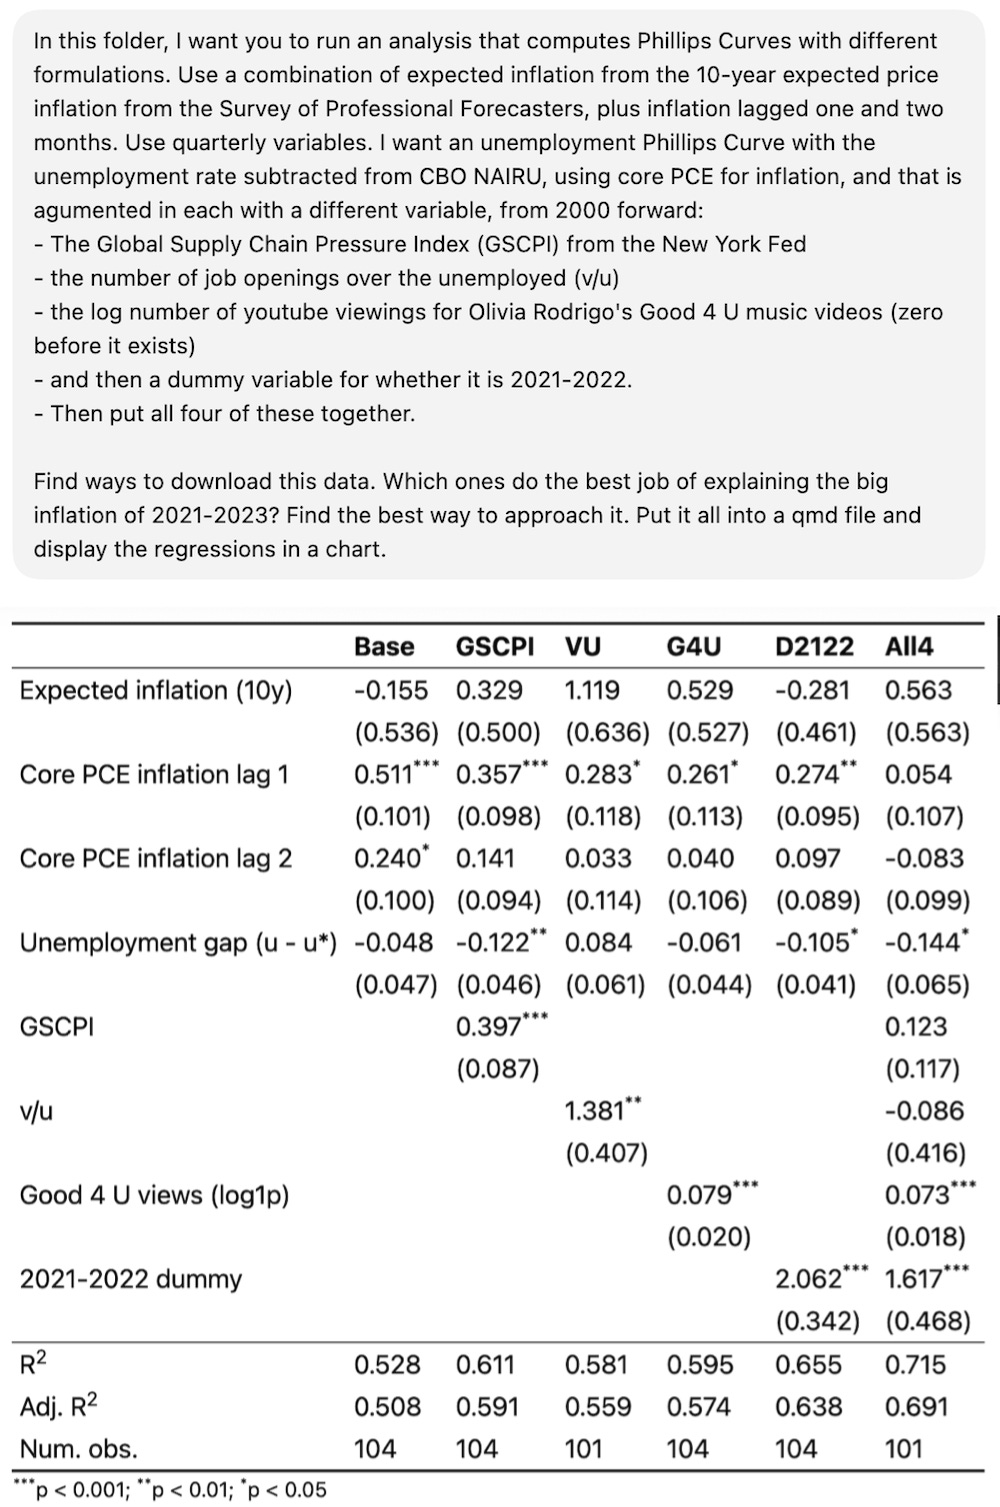
It got the data and did the analysis with one call.2 From the R-squared above, reflecting a few clean-up calls, Olivia Rodrigo does a better job estimating inflation than vacancies-to-unemployment. (The unit is log(good 4 u views + 1)). If you put them all together, only the dummy variable and the “good 4 u” variable are significant.
You will, no doubt, have more normal and productive projects you want to explore and see if they are worth developing fully. The real work is finding good questions and understanding how to make the results rigorous. Using the terminal gets you to where you can focus on what matters the most.
Use 3: Anticipating Arguments You Might Not Know Ahead of Time
Keeping with that blog post on essentials: I do not know the complicated microeconomic derivations as well as I should. What differentiates Hicksian from Marshallian demand does not come naturally to me. It’s been almost twenty years, and I still occasionally have nightmares about that one chart from Chapter 3 of Mas-Colell.
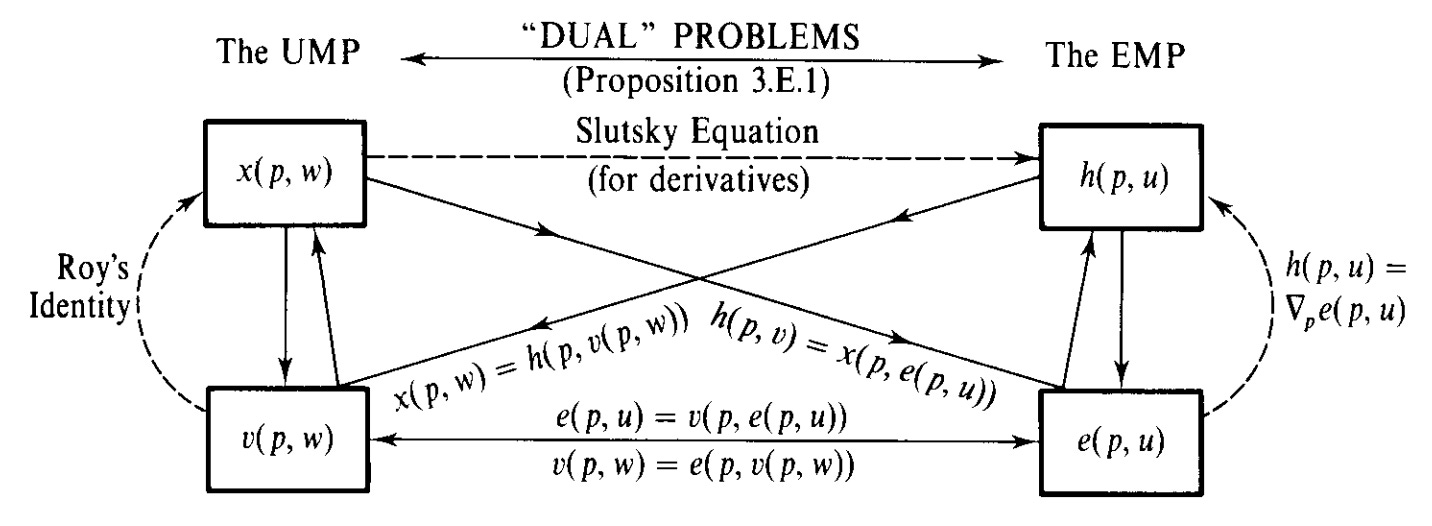
But my recent post on essentials (and a previous one on DoorDash) touches on how groceries and shelter behave differently from restaurants and delivery services as income changes. I wanted to understand how rigorous demand theory would assess what I’d written. So I asked the terminal to take a look:
AIDS here is the Almost Ideal Demand System, a standard model in microeconomics for estimating how consumer spending shifts across goods when prices and incomes change. (Angus Deaton and John Muellbauer published their groundbreaking work in 1980, roughly two years before they would have named it literally anything else.) It generated this analysis:
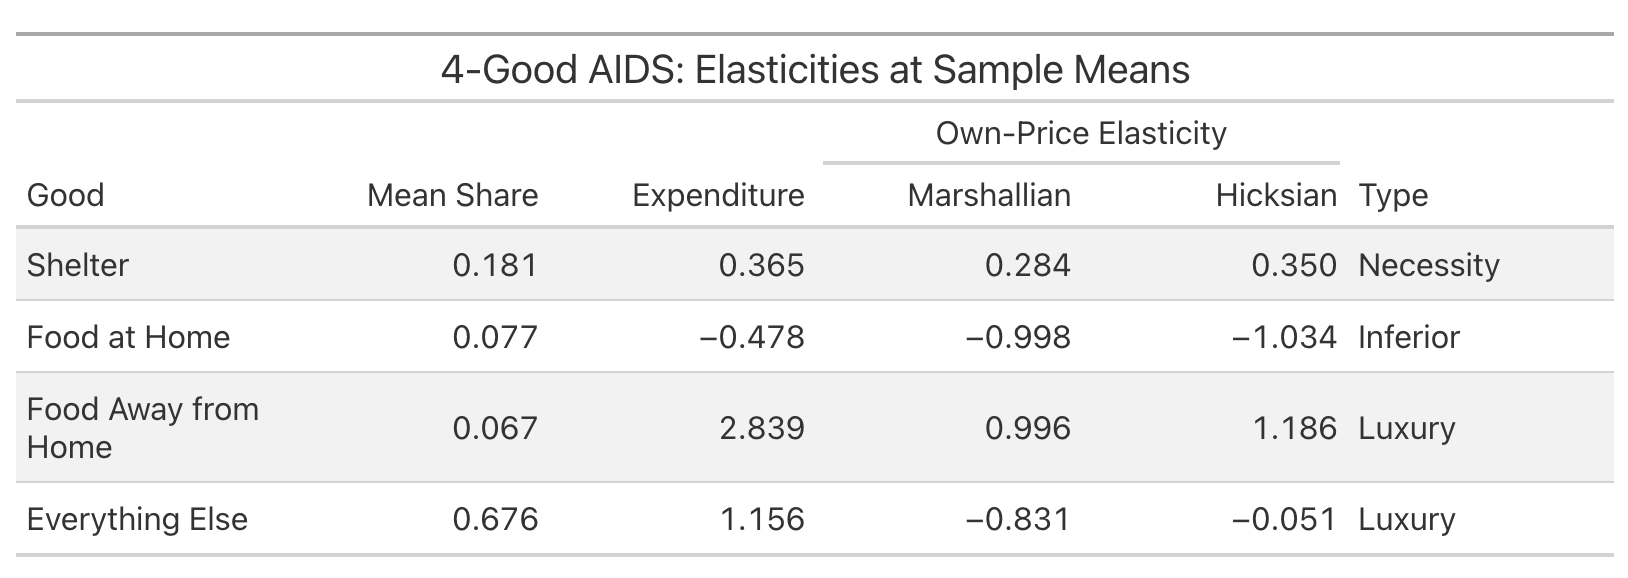
I have no idea if this analysis was executed correctly. But I do know that on a first pass, an approximation of the analysis doesn’t disprove my instinct that food and shelter behave like my post argues they do. My argument wasn’t conditional on this, and I don’t advertise it. But I now think I’m not going to take obvious incoming criticism on something I missed. And more importantly, this gives me an incentive to learn more and continue digging on this topic.
A lot of analytical work is anticipating good-faith skepticism. You know the argument you're making, but you're less sure what the specialist counterargument looks like. These tools let you run a first-pass stress test against these other frameworks, cheaply enough that you can do it before every major piece rather than only after you've already taken the incoming.
Is It Game Over?
All of this makes me better at my work. My software background helps, as I can proofread the code, double-check what it’s actually doing, and catch errors in the methodology. But I’m also wondering if I should be switching fields ASAP.
Who knows what the future holds? But I keep running a version of this test: I put the Survey of Consumer Finances data, a triennial survey by the Federal Reserve on household incomes, debts, and assets, in a folder, and ask the AI to find the most interesting results. It gives me simple summary statistics. I ask it to find both unique policy insights and business opportunities, and it gave me very generic ideas. I asked it to use linear regressions, figuring it could just p-hack something, and it gave me very little. I keep running a version of this, asking AI to find what’s interesting about a project independent of any direction from me, and it really can’t do it.
So this still looks like an extreme version of labor-saving technology. It makes people faster at a given set of tasks, and it lets you cover more ground with the same resources. Which effect dominates, fewer people or more output per person, is an open question. My experience, at least for now, is that it can complement people who know how to use it, but risks shortcutting those earlier in their careers before they’ve learned the building blocks.
Last summer I was so conflicted about giving up RStudio for Positron, a VS Code fork that integrates Python and Quarto more naturally into R development. Now I keep Positron open to check while I work in the terminal. Whatever happens with AI bubbles and buildouts, the economics of my own work have changed permanently. I can do in twenty minutes what used to take half a day. This means I ask more questions, check more assumptions, and cover more ground. I still believe the tools can’t identify what’s interesting or draw the right conclusions on their own. But they’ve made exploring what’s right a lot cheaper.
This Substack, and the way AI changes how we investigate issues here, reflects my own personal views and not my employer. As for background, I earned a bachelor’s degree in computer science and mathematics in 2001, and worked as a software and financial engineer for many years before embarking on an economics career. So I’m not new to coding, but I haven’t done it professionally in a long time. I took a class in assembly language in college, and did a lot in C++. When I first encountered Perl, I felt like I was cheating, that I was just talking at the computer. Where were the pointers? But I got over that quickly. Better tools are better. And now, with terminal tools, I literally just talk at the computer to code.
I also have found AI to be both transformative but also “normal” technology (in the Narayanan and Kapoor sense, contrasted with an impending superintelligence). My prior was that search technology had stalled in the early 2010s and this is catch-up for a decade of lost advancement. As for AGI and the probability of AI destroying civilization, I pay for fire insurance on my house even though I don’t expect to have a fire. It would be nice for society to take on similar insurance at a societal level on AI.
My favorite part was watching it attempt to get the GSCPI data from the New York Fed and the Survey of Professional Forecasters from the Philly Fed over and over from their difficult XLS files until it was successful. Those Feds apparently can’t put that data in FRED like a normal regional Fed. But now I have Python code that automates downloading it, something LLMs struggled with even a few years ago.
"My experience, at least for now, is that it can complement people who know how to use it, but risks shortcutting those earlier in their careers before they’ve learned the building blocks."
That's my big concern.
How much of your ability to formulate useful questions and suss out bullshit in the results is from an earlier period of having mucked around in the data and developed reality-based intuition about it?
What's the path for a current 18-year-old?
When the machine can relatively easily get them a thing that looks like an answer, when do they develop the internal model of the world that enables them to usefully poke at the results?
Excellent post, informative and down-to-earth. Hard to find that sometimes amidst the sea of hypesters, grifters, doomers and head-in-the-sand skeptics.