

One of the great ironies of the second Trump administration has been that, despite their attempt to reassert a male breadwinner family model and make a gender vibe shift, men have gained no jobs under it. In December 2024, there were 79,332,000 men employed in the Current Employment Statistics survey. In August 2026, there were 79,326,000, a decline of 6,000. That’s as 759,000 overall jobs were created. Here’s the chart:
Now job growth was essentially flat in 2025, with health care hiring canceling out the losses in federal employment after DOGE, in trade and transportation and manufacturing after the tariffs, and in professional and business services. Since Trump took office, private education and health services added 1,029,000 jobs against an economy-wide gain of 759,000, so one sector that is 77 percent female more than accounts for all net job growth since Trump took office. But even if you start the clock in November of last year or March of this year, after job growth picked back up, men got only 11 and 9 percent of the jobs, respectively. Even with last month’s surprise 162,000 jobs, 158,000 of them went to women.
This is a very new trend. The gender split across 2023-2024 was a much more balanced 53 percent women. It’s starting to get more attention. This bounced around the news last week with President Trump posting “No wonder they like me!!! President DJT” in response to a headline saying this; DailyWire and The Daily Beast are now covering it.
There are two takeaways here. First the Trump administration is trying to force women out of the workforce under the idea that their tariffs, deportations, and other economic policies are creating a workforce more accommodating to men. Last week, HHS was reported to be drafting a rule that would redirect child care funds away from working parents and toward married parents with a parent raising a child at home. On education, last year’s reconciliation bill capped how much graduate students can borrow unless they are in a “professional degree” program, a definition that initially left graduate nursing off the list and is still in litigation.
I think this is wrong by itself on any number of grounds. But it’s worth dwelling on the fact that they can’t even deliver on the reactionary promise they’ve made. No matter the mess they make of the economy between random trade wars and political pressures on the central bank, they can’t deliver job growth in industries that employ men. And all their “your body, my choice” hate and reaction isn’t putting the toothpaste back in the tube when it comes to women’s active participation in the economic realm. All their effort at a gender vibe shift is in service of a plan that is failing on its own terms.
Second, this is not from women taking on more jobs, or industries becoming more female; this is overwhelmingly, on the order of 84 percent or more, about industries that employ more women growing faster. There will be a conservative spin that this is all about girlbosses, or discrimination against men, or subsidies for working women. There’s no empirical evidence for that. They are simply failing at what they have set out to do. But we can look at this in a more detailed way.
Shift Share
Let’s take apart the data. This is all from the Current Employment Statistics survey (CES). The CES is where we get the monthly jobs numbers. Because it’s a survey of employers, we trust the numbers pretty well on the first pass and we can get some pretty detailed industry data.1
For this we’re going to do a shift-share decomposition. We did this on the longer gender employment trends earlier in the year here; Justin Wolfers at his new Platypus Economics also used this method at the beginning of the summer on the recent numbers. We’re going to split the labor market into different industries based on levels of aggregation, more on that in a second, each with its level of female employment in December 2024 and the latest available month: August 2026 for the supersectors, July 2026 for the second cut, since the more detailed industry data is published on roughly a one-month lag.
Then we’re going to split the change into two parts. The first is how much industries with more women are growing faster than the rest, what we call an increase between industries. The other is how much women are taking over more jobs across all industries, an increase within industries. You can get the math in the footnote at the bottom and the code is on GitHub here; this is a well-established procedure.2
We’re going to do two levels of aggregation. The first uses the eleven supersectors (e.g. manufacturing, information, government), you’ll see their names in a second. This is the highest level of aggregation: it covers 100 percent of employment, and reports female employment for all of it. The second is our own generated “second cut,” which uses a depth-first algorithm to assemble industries that go as deep as the 4th display level of BLS data, bubbling up to a coarser industry only where BLS itself doesn’t publish anything more detailed for that branch. This gives us 102 subindustries covering 100 percent of employment. Only 98 of them report female employment, but that still covers 99.5 percent of the labor market, since the four without it are all small.
Here are the between and within summaries for both.
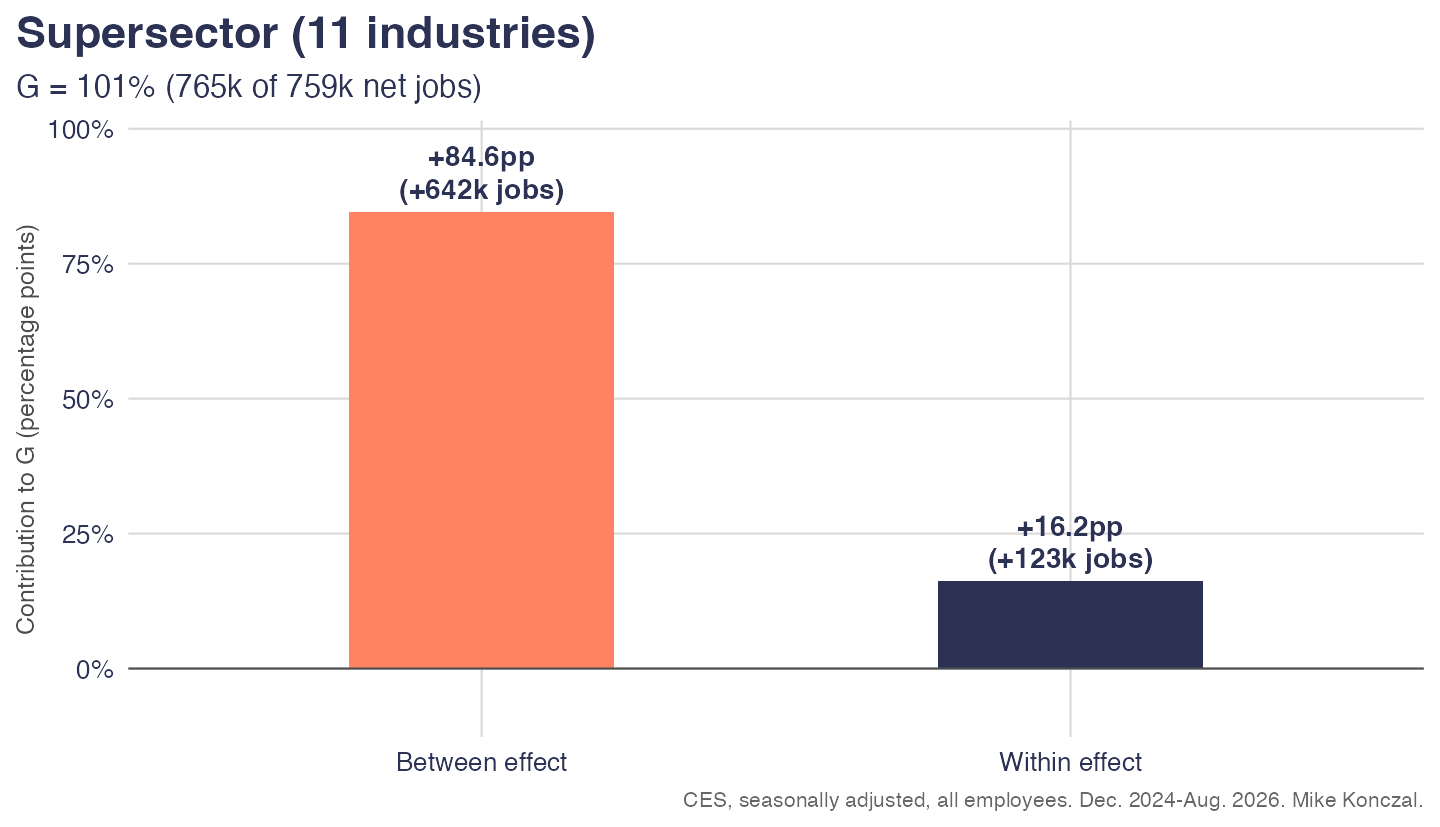
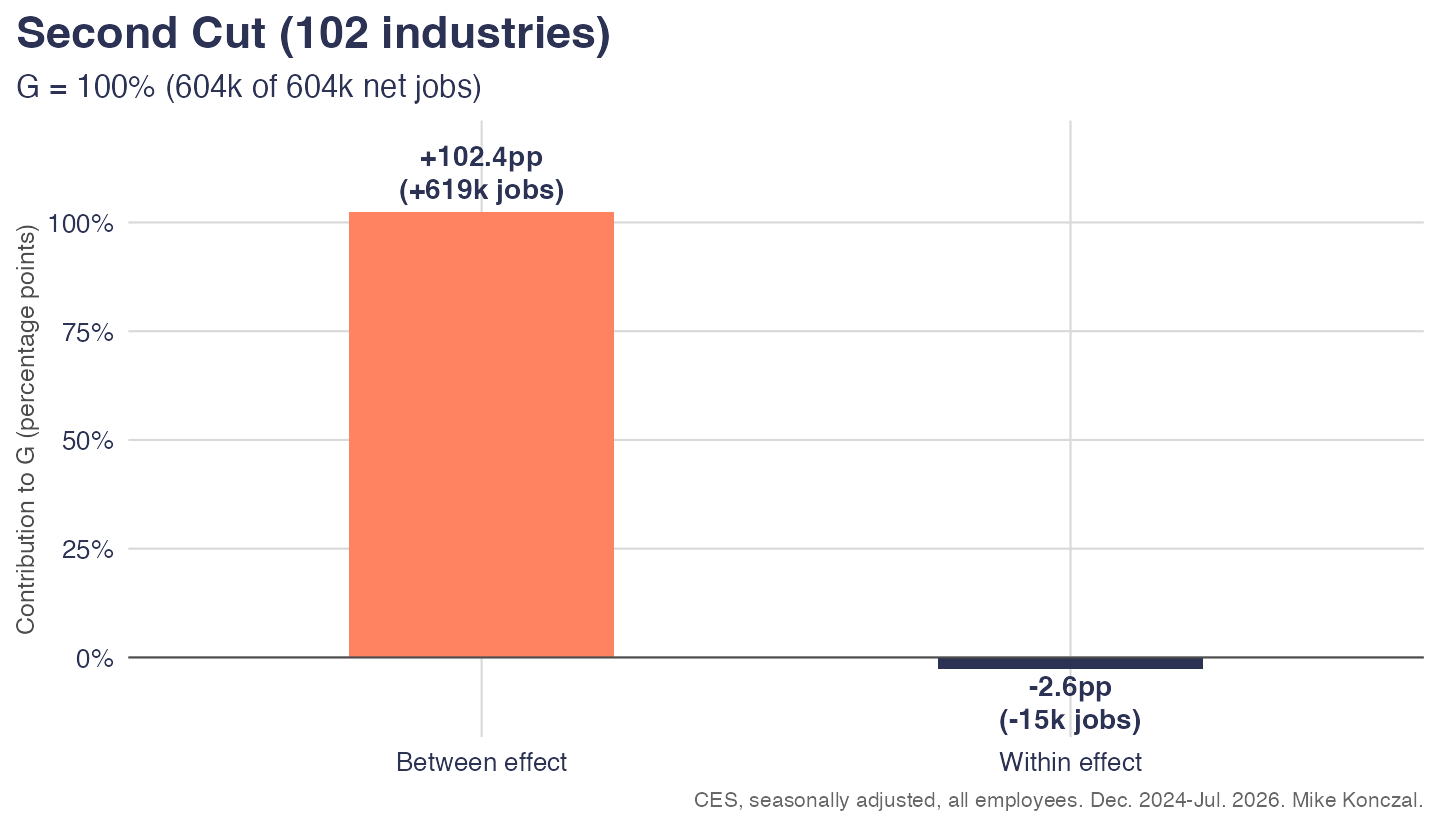
Women gained 101 percent of jobs. Of the 765,000 jobs women gained at the highest aggregation, 84 percent came from the between effect and only 16 percent from the within effect. The second cut tells an even more damning story: women gained 100 percent of jobs there, and 103 percent of their gains came from the between effect, with the within effect running slightly negative at -3 percent. Industries actually got slightly more male the deeper we look even as they didn’t get any net jobs, the opposite of the girlboss effect. It’s just that the largely female industries like health care grew faster.
Here is a chart of each industry:
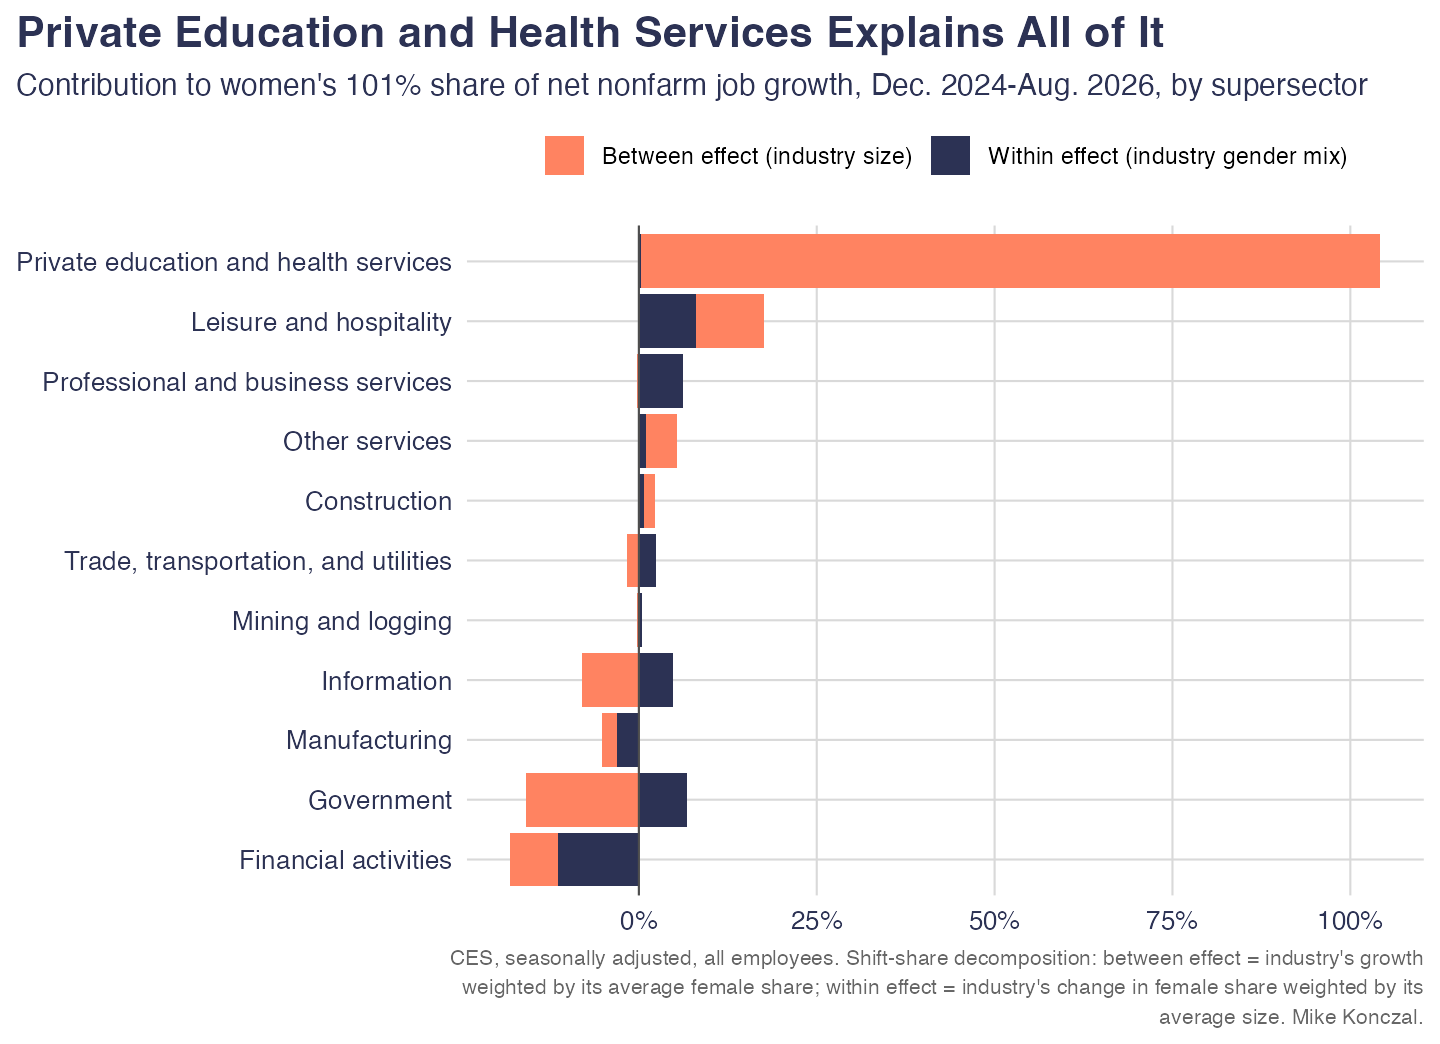
It seems like the labor market has turned a corner since last November, when the unemployment rate peaked at 4.5 percent. Rerunning this analysis since last November gives us basically the same results. Since November 2025 women have gained 89 percent of the total jobs. Of the 555,000 jobs women gained over those months, 65 percent came from the between effect and 35 percent from the within effect, so the between effect is still the large majority of the story.
So total job growth is broader and less razor-thin than the headline number suggests, but there is no sign whatsoever that the administration’s approach has revived male-coded industries relative to female ones. If anything the story is remarkably stable. Women are still capturing the large majority of net job growth, still overwhelmingly through health care, and men are still waiting on a manufacturing and blue-collar revival that the data, basic economics, and common sense all say won’t show up with their approach.
For what’s going on in the CPS we can turn to friend of the blog Guy Berger here; note in general I like CPS for rates but not for raw numbers, and when it comes to job growth specifically I think it adds little signal on the monthly basis compared to CES.
E_i is employment in industry i, W_i is women’s employment there, and s_i = W_i / E_i for its female share.
And this growth is occurring even with Return to office policies which acts to dissuade women from working (thankfully it looks like RTO has stalled and 1-2 day work from home has become the standard)
This: "First the Trump administration is trying to force women out of the workforce under the idea that their tariffs, deportations, and other economic policies are creating a workforce more accommodating to men." is a nonsense, ridiculous statement. You people need to stop doing this type of hysterical commentary.