
The Eldest Millennials Had the Same Fertility as the Youngest Baby Boomers
How U.S. fertility is happening later, not less.

With the government shutdown, there’s been no new economic data, and it’s been very boring without any new numbers to investigate. So I decided to get to the bottom of this fertility crisis everyone is always arguing about. I’ll say up front that I didn’t have a strong take on the topic. I’m not experienced in these debates, but I am careful with data and can share what I find.1
I decided to dig into recent microdata from IPUMS: the 2024 CPS Fertility Supplement. The survey is fielded every two years with Census, with the most recent round in 2024. Unlike some other statistics, which only show births in a given year, the supplement captures cumulative births across the life cycle, making it one of our better windows into long-run patterns in fertility. I find I can replicate the aggregate Census numbers from the microdata, and then we’re off.
One thing stands out: the eldest millennials have the same completed fertility rates as the youngest boomers. There’s been no drop within the 21st century of the number of kids a woman has once she reaches 44 years old. That stability might surprise you given the popular narratives about collapsing family formation, and it’s worth diving into the data.
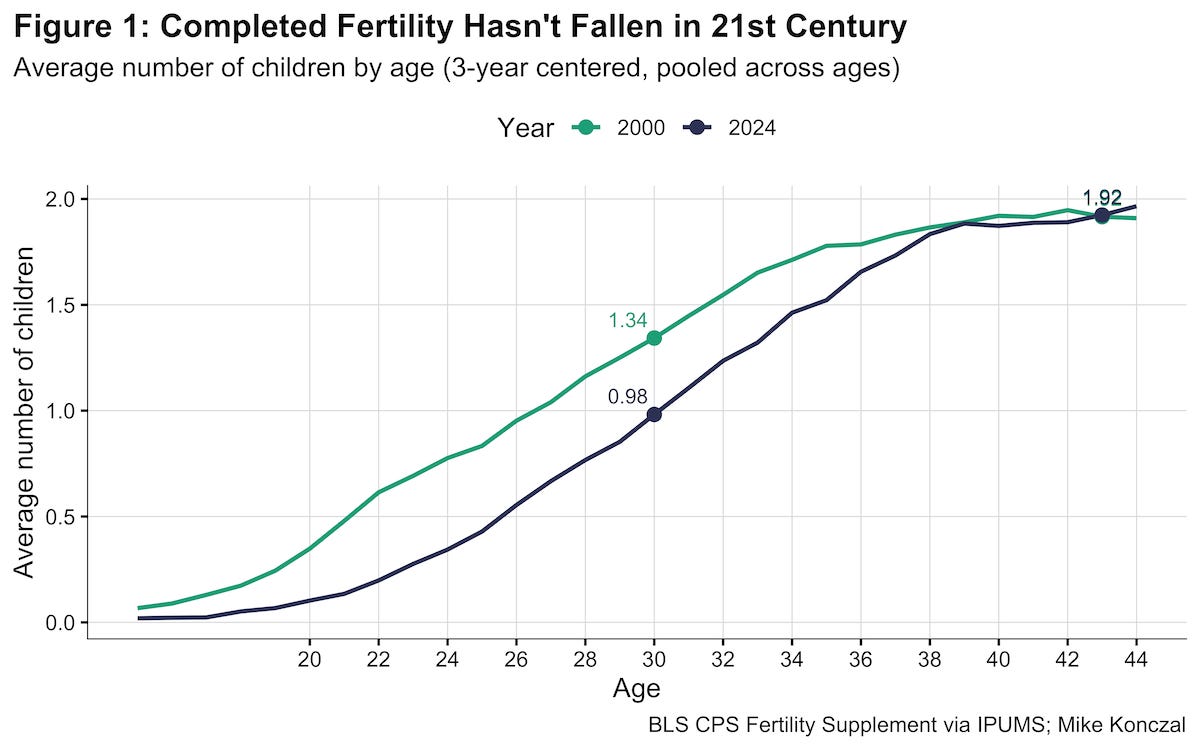
Figure 1 shows the average number of births by age, taken as a cross-section across two years. In the graphs here and elsewhere, I use three-year averages around each age, though the results look the same either way. The underlying variable is “Number of live births ever had” and the question is “Altogether how many children (have/has) (name/you) ever given birth to?” For women at each age, we sum up all the births, and divide that number by the total number of women to get the average.
Completed Fertility
In the year 2000, the green line above in Figure 1, a 43-year-old woman, who is among the younger baby boomers, averaged 1.92 births. In the year 2024, the navy line, a 43-year-old woman, who is among the eldest millennials, averaged 1.92 births. (For age context, a voice of a generation, the fictional core millennial Hannah Horvath from HBO’s Girls, turns 36 this year.)
You have probably heard of total fertility in the news; more on that in a bit. But the term here is completed fertility, the number of children a woman has by the end of her reproductive years, usually measured as an average for the early-to-mid 40s. This stability is well known; other analyses confirm that completed fertility has been essentially flat since 2000 (Census 2024, Pew 2018, BGSU 2023). But it’s worth emphasizing that this holds all the way through the 2024 data.
What has changed is the timing of births. Remember this is a cross-section based on the year we are observing. In 2000, a 30-year-old woman had, on average, 1.34 children. In 2024, that number had dropped to 0.98. The two cross-years ended up in the same place, but they follow very different paths to get there.
Before you ask, is this all immigration? No. We can track nativity status in this data. For women 41 to 44 who have at least one native-born parent, the weighted average number of children was 1.88 in 2000 and 1.87 in 2024.
Now completed fertility used to be higher than it is today. So when did the drop happen? We can look at the average number of births for women ages 41 to 44 in each CPS Fertility Supplement, going back every two years to 1976, as shown in Figure 2:
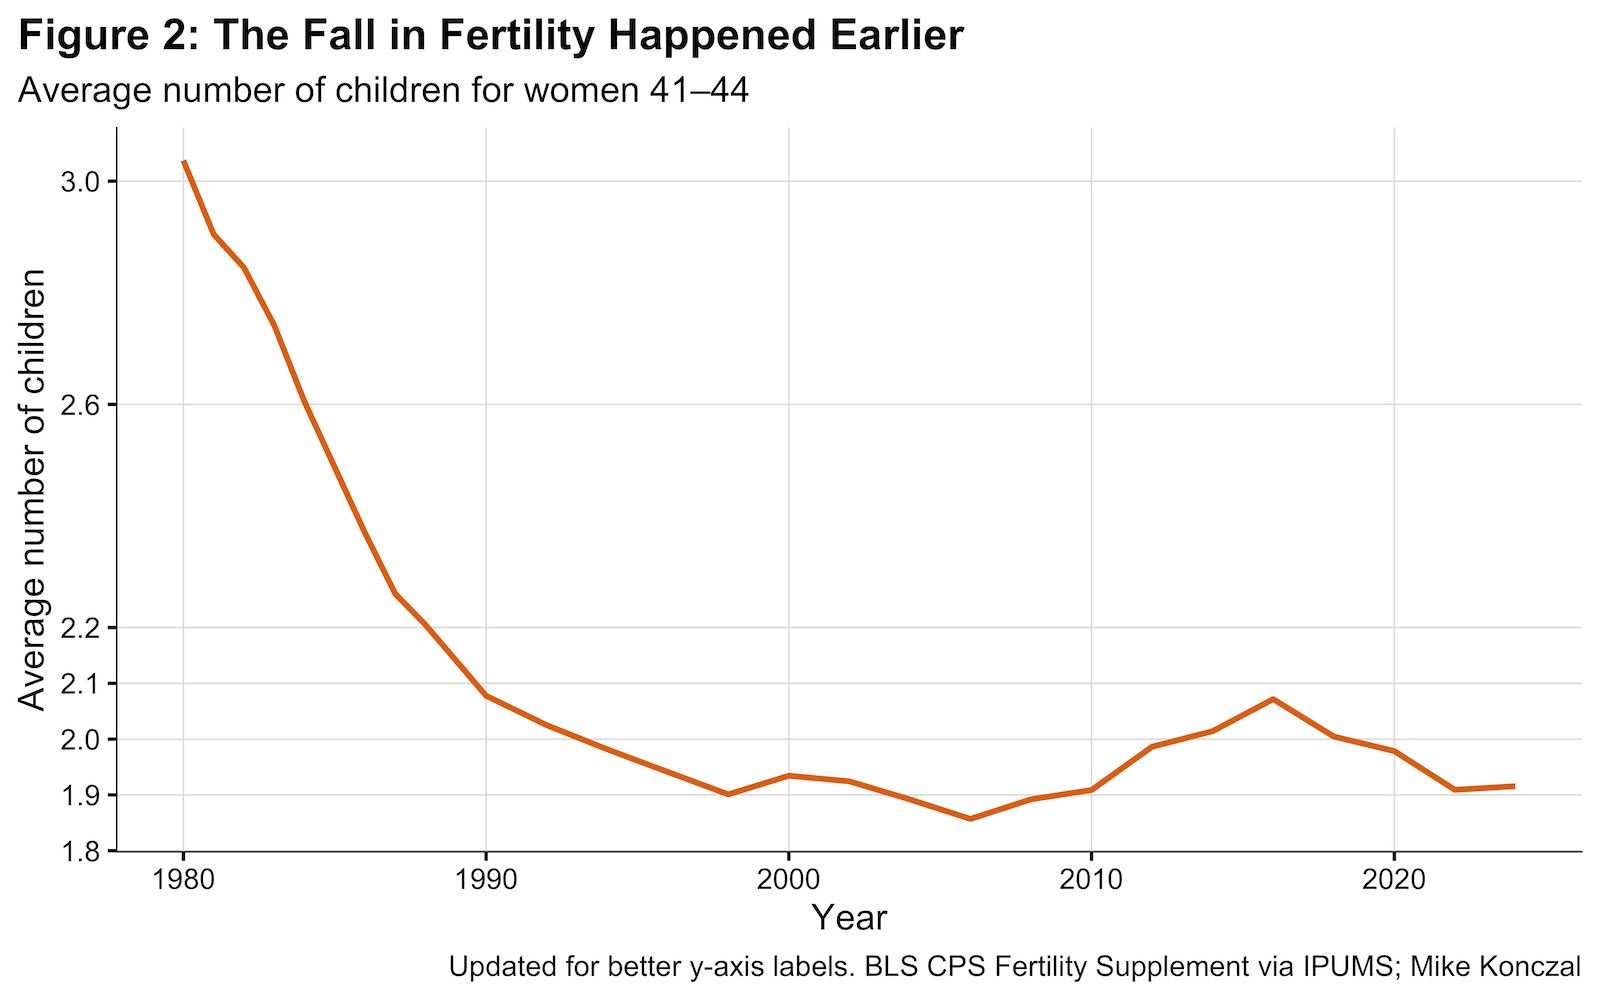
The big drop happened some time ago. There has been some variation since 2000. It hits a low of 1.86 in 2006, and a high of 2.07 in 2016. (What’s going on with those born around 1974?) But the headline is how stable completed fertility has been for more than two decades.
The Biggest Generation Happening
One reason you’ve probably heard about a fertility crisis is that the total fertility rate (TFR), which is the average number of children a woman is expected to have over her lifetime based on today’s birth rates, has declined. But TFR is sensitive to and misled by timing shifts like the one above. As Matt Bruenig once wrote, it’s “kind of a nonsense statistic.” If births shift later, even if the total number doesn’t ultimately change, TFR mechanically falls for a period. A birth disappears for a specific year, and TFR can’t observe the later birth that offsets it.
Demographers separate fertility into quantum (the eventual number of children, like completed fertility) and tempo (the timing of childbearing, like TFR). Completed fertility is a quantum measure, and that can be misleading in real time as well because we only know the final tally once a cohort finishes childbearing. If there were a genuine collapse in fertility underway, the completed fertility metric would reveal it only after the fact.
This is relevant because the largest single-year cohorts in the United States right now are those ages 34 and 35. These are the 1990 and 1991 birth cohorts that are the later millennials. To get a sense of this, Figure 3 is a chart of the age distribution in the United States for 2024 from Census data:
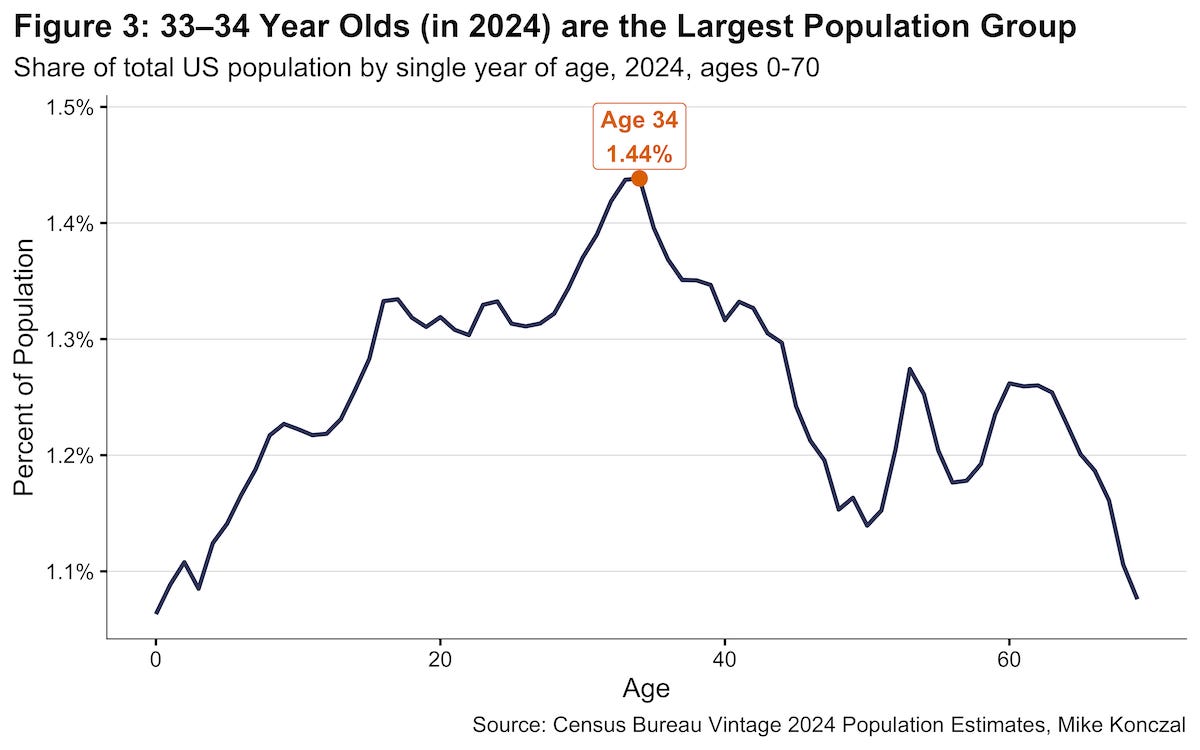
Jeanna Smialek, who is in that cohort, had a great piece last year on this generation as an economic-distorting force moving through the life-cycle in the New York Times (titled “It’s Me, Hi, I’m the Problem. I’m 33”). What happens to them is probably going to be an important part of demographics going forward. We can follow 34-year-olds in 2024 to get a sense in Figure 4, and compare them to slightly older cohorts:
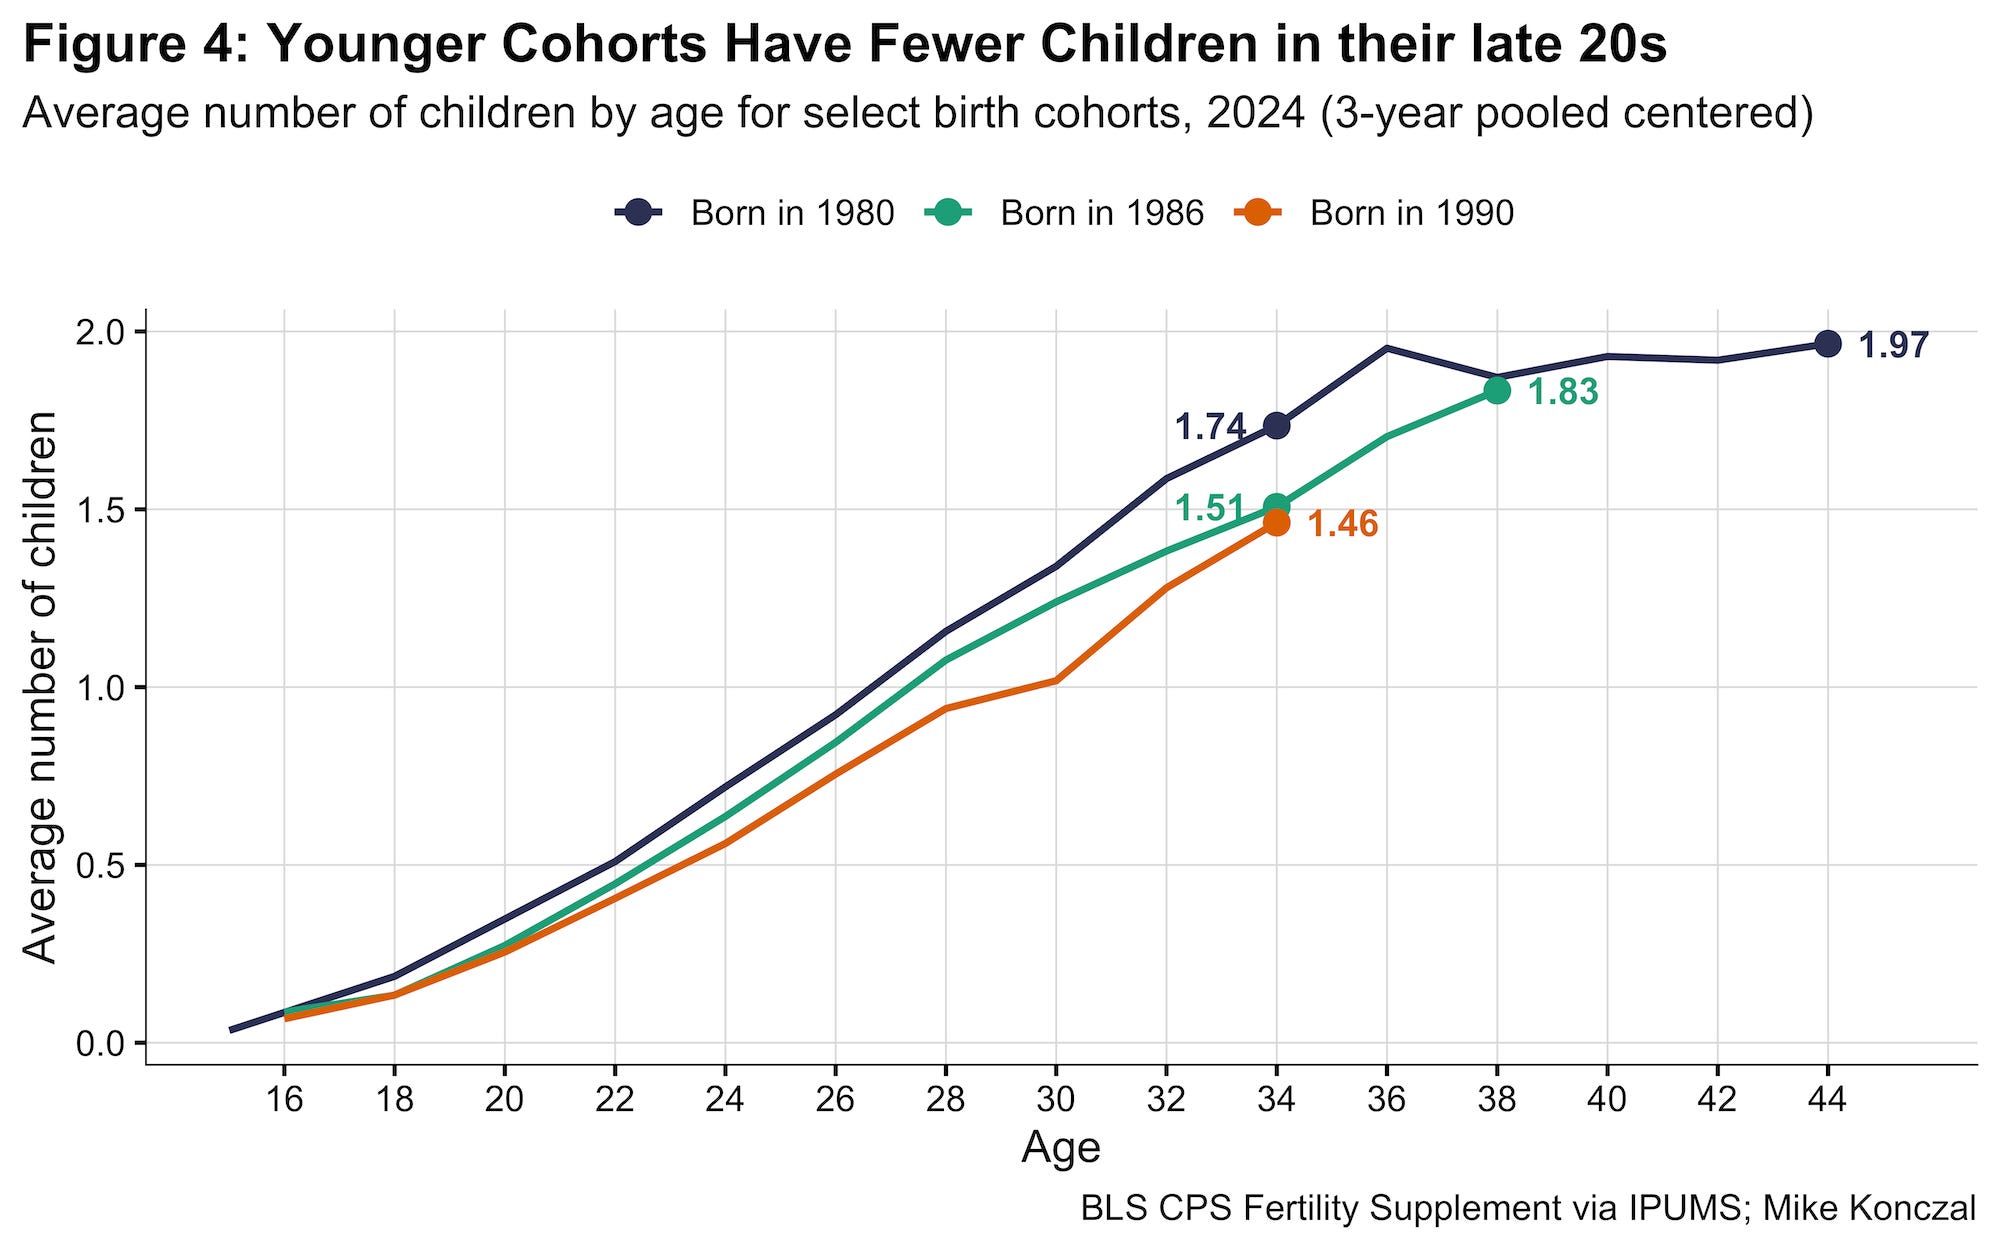
Figure 4 plots completed fertility on the y-axis for people born in 1980, 1986, and 1990, from the point of view of the year 2024. So 34-year-olds in 2024 (born 1990) have a completed fertility of 1.46. This is comparable to 38-year-olds now, who, when they were 34, had a completed fertility of 1.51. Note however, that they were lower than the 44-year-old cohort, who were at 1.74 at that age. But the 38-year-olds caught up to the trend of the 44-year-olds. The 34-year-olds seem to be catching up as well?
Take a second to understand Figure 4, because we’re going to extend it to every year born between 1980 and 1991. Figure 5 provides that spaghetti-style graphic:
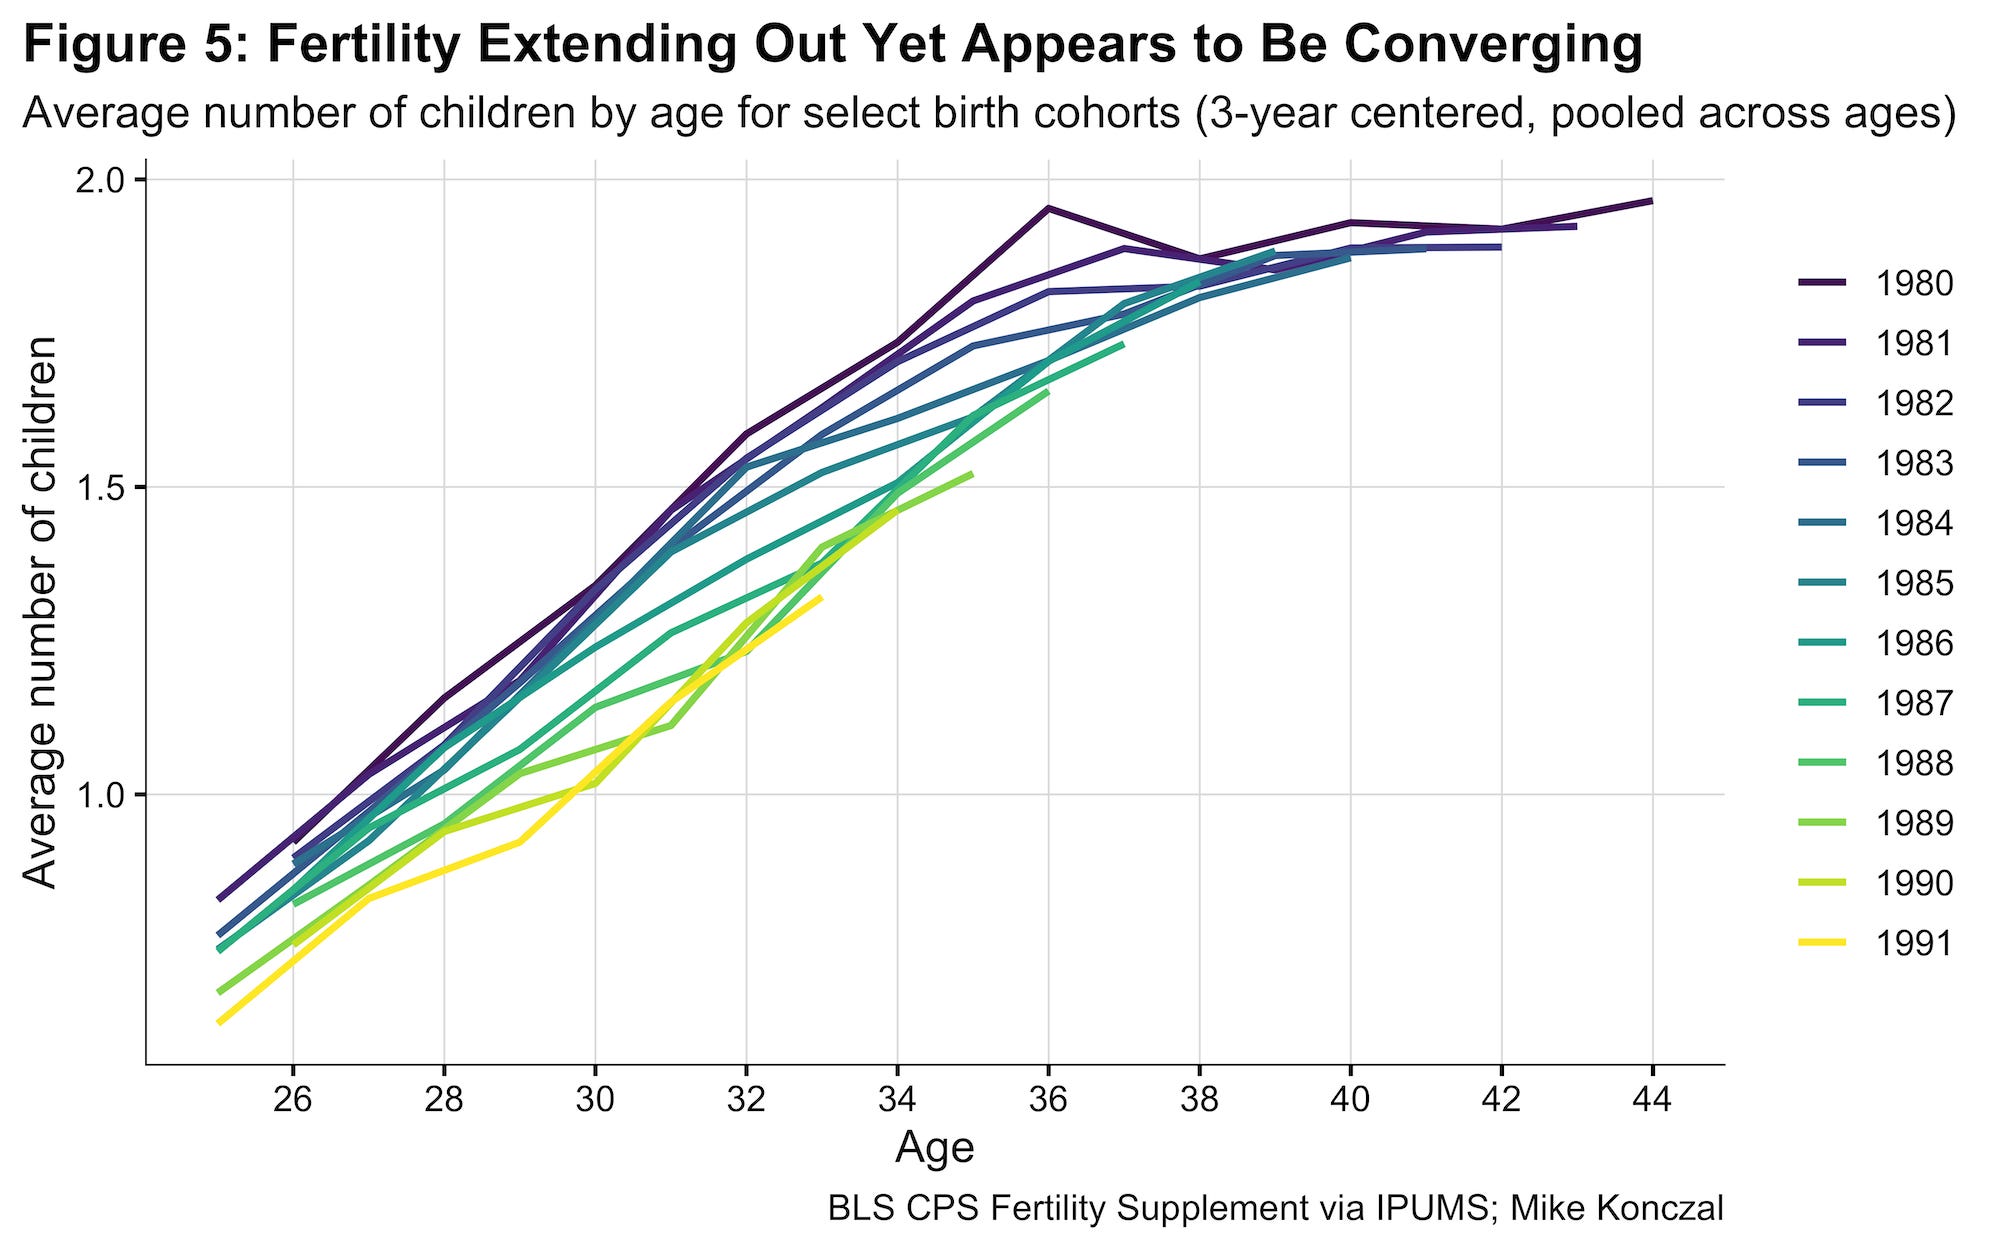
This might be the graph of the post. You can see a shift happening here, as if the entire profile were shifted outward to the right. Yet it appears to still be forming a consistent line and converging. If true, it’s not resulting in fewer kids, but just having kids later. Using some estimates, it looks like, for a given average number of children, the age has shifted to the right by between 2-3 years.
By Generations
So there was a shift. How can we visualize how this happened? Let’s go big, and look at the change in fertility at each age within the 21st century. In Figure 6, I’m going to color-code the lines by generation. Some quick age bands: Baby Boomers are born through 1964; millennials begin in 1981. Generation Z begins in 1997, making the oldest Zoomers 27 in 2024.
In Figure 6, I’m rescaling each y-axis to highlight the relevant shape of each series, while keeping the x-axis consistent across all plots: the years 2000 through 2024, with data from every even year in the CPS Fertility Supplement. This lets us watch how the tempo slowdown is evolving across time. But it does mean paying attention to the scale of each y-axis, which varies.
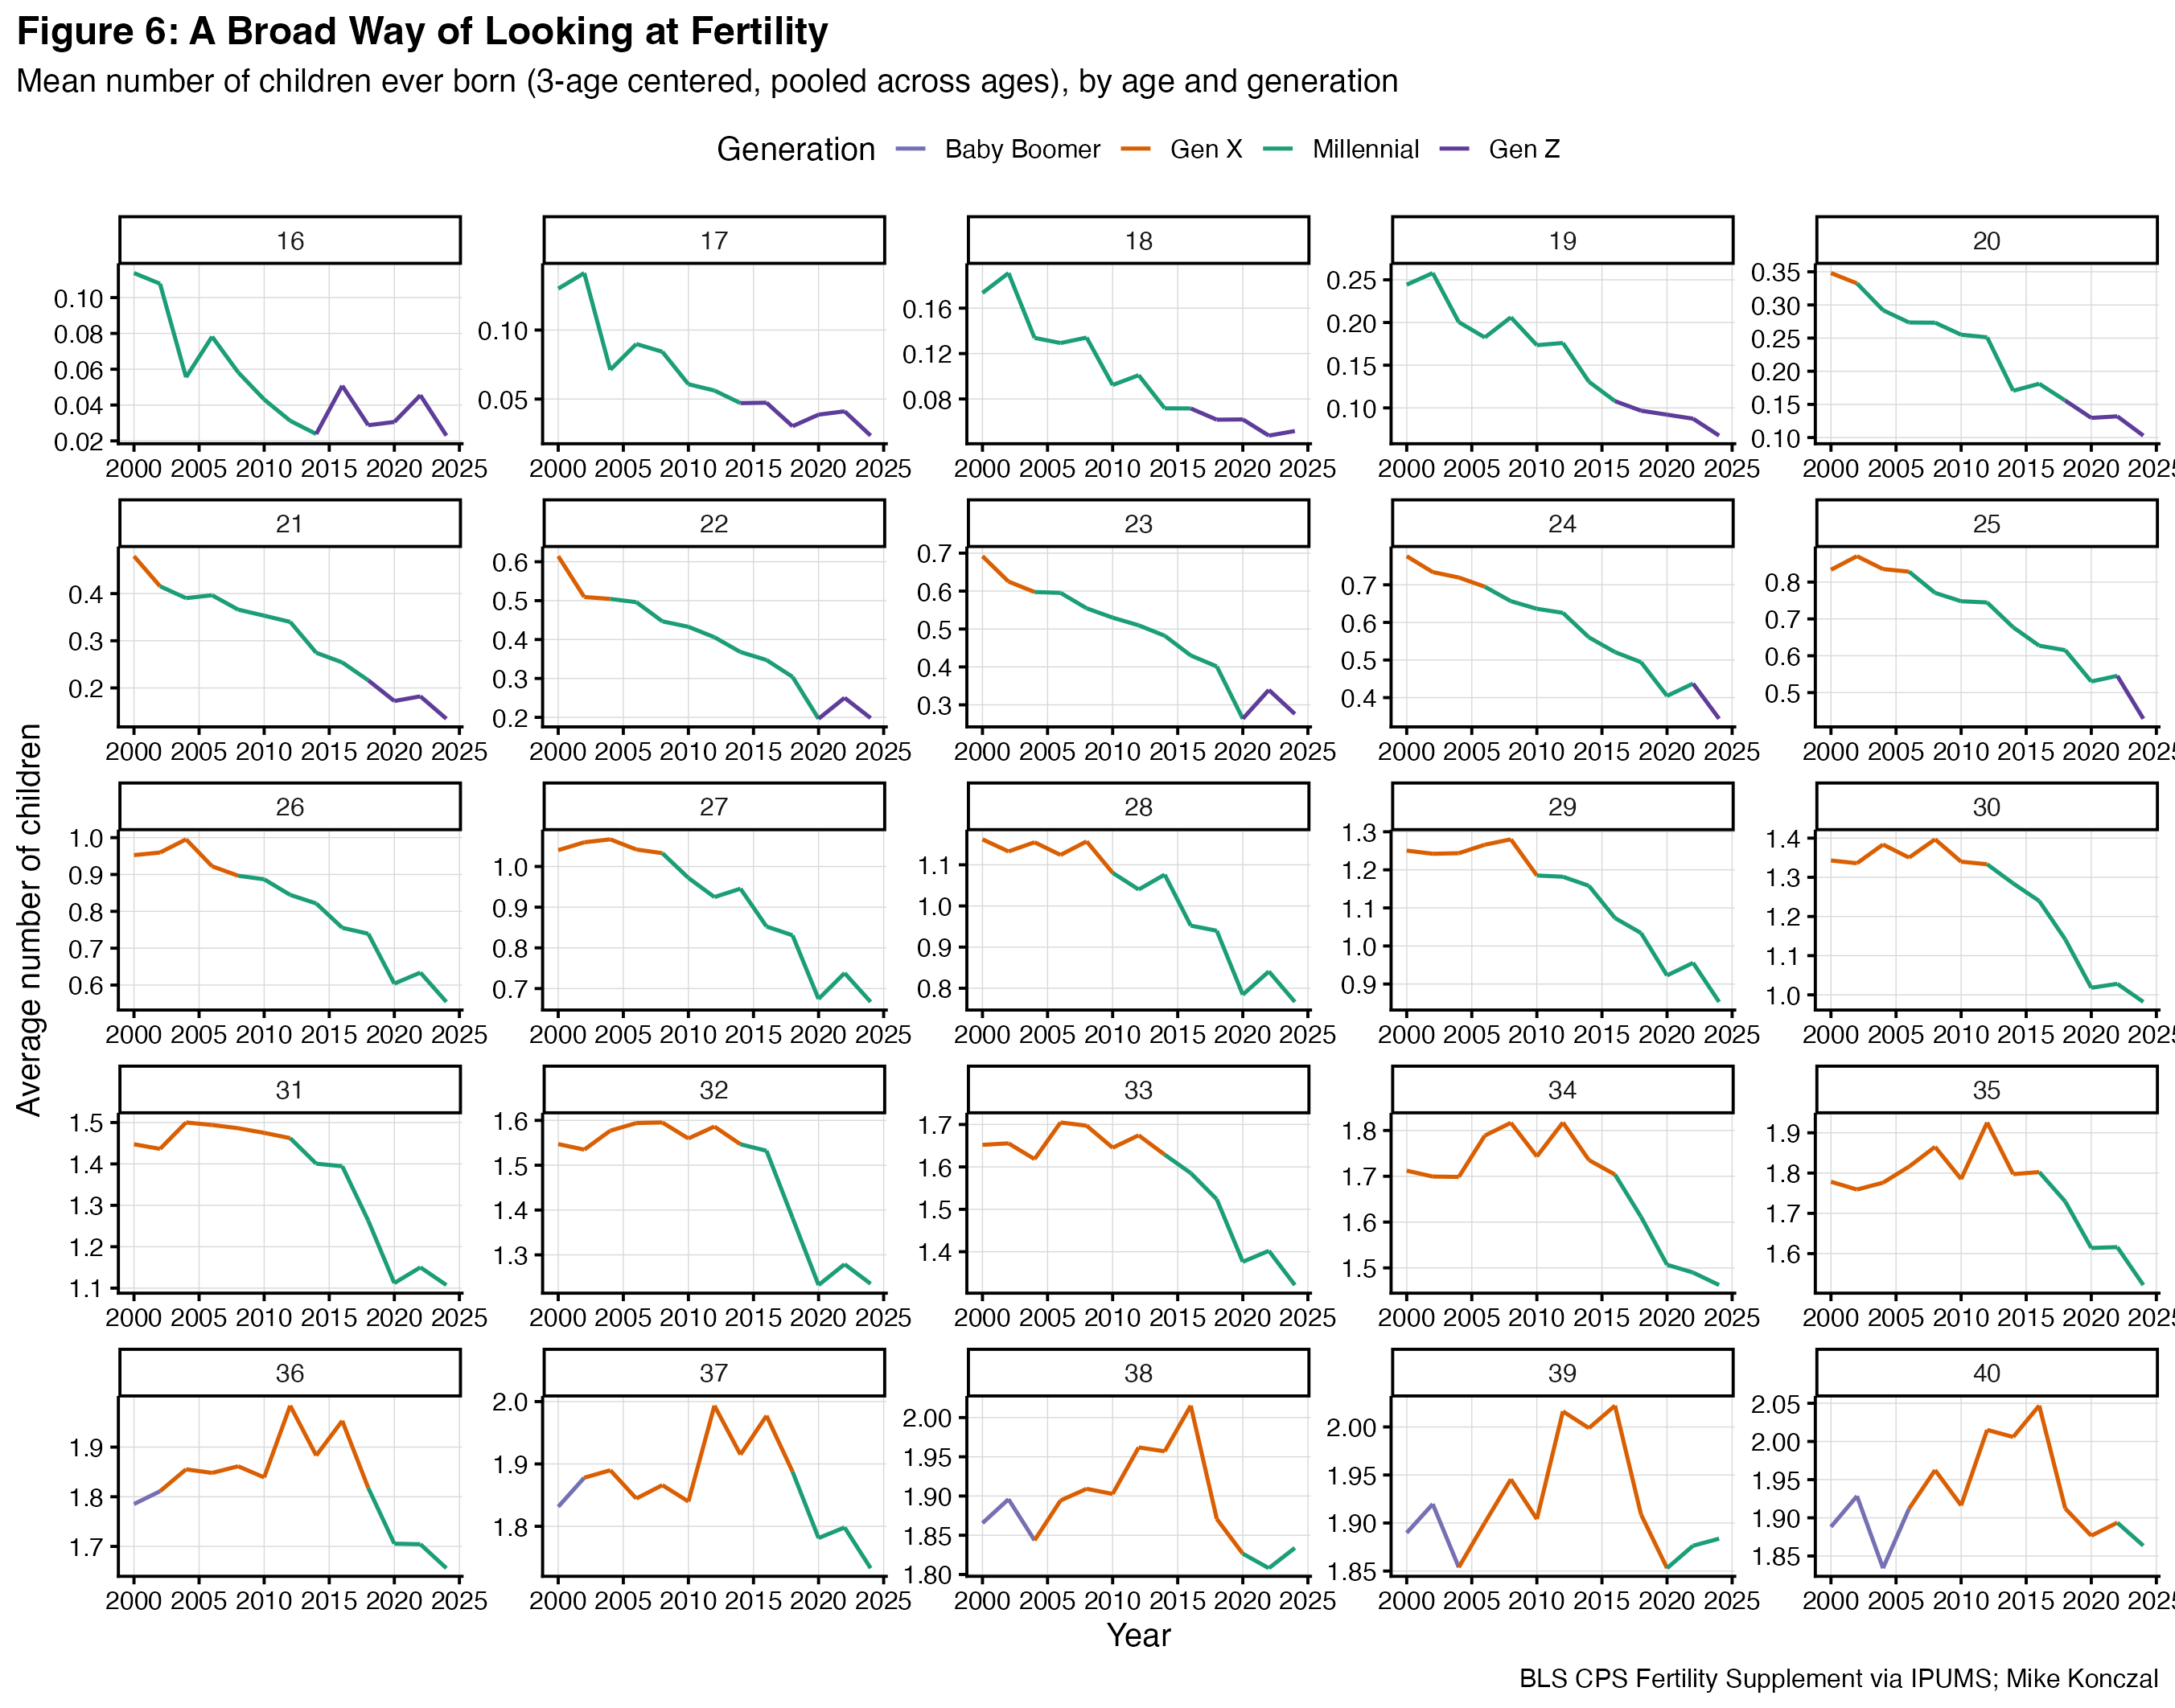
How should you read this? Take the box for age 30. For a 30-year-old, from 2000 through roughly 2010, the pattern is stable: they consistently had between 1.3 and 1.4 children by that age. Then, right after 2010, the floor drops out. By 2020, the completed births at age 30 land around 1.0. That’s a big shift in a short window.
There’s a lot here. Where to begin?
There’s a break between 2008 and 2014 that looks especially clear from ages 28 to 33. The Great Recession casts a long shadow. A recovery that may have been slower than the Great Depression isn’t a great way to keep demographic trends stable. Real median household income falls over 5% during this time, so it’s probably not higher wages delaying children. But smartphones also became ubiquitous during this period. This mix is one reason I’m always hesitant on “the slowdown is across peer countries, what can you do?” arguments. Whether it’s that recession or tech, there are things that link countries that are distinct events and policy choices.
It appears that there’s been some flattening of the drop in 2022 to 2024. See the ages 26 to 32 for some sense of this, where it’s pretty flat 2020 through 2024. I try not to over-index on any single year, but it’s worth people investigating this more fully. Why is this? Perhaps hybrid work has allowed for more flexibility in building a family (see Bailey, Currie and Schwandt (2023)). Is this the “vibe shift”? Maybe income support and wage compression during the recovery played a role. Did the inflation wave make having a perpetual youth of low-cost services seem less attainable than starting a family? Having the cause of something that may or may not have happened already be overdetermined is part of the fun of this work.
The decline in teenage pregnancy is a major story here and it rarely gets discussed. We have, as measured here, the average number of children for 17-year-olds around 0.13 in 2000. That’s around one in eight, and that goes to 0.024 by 2024. That’s a near-total disappearance of teen childbearing over a single generation. Any model of tempo or quantum that ignores this shift is missing a central piece of the puzzle.
You probably have your own questions and interest in the numbers. I wanted to see how well I can incorporate vibecoded apps into blog posts. So I decided to vibecode a visualization app to display the data multiple ways using Google AI Studio with Gemini 3, which was surprisingly easy (about 20 minutes start to end). However, I can’t display it here, but you can click here or on the graphic below to see it yourself at my website. Click on your age and year if you so dare!

Tools and Measures
For something that is so often framed as a priority among elites, it’s remarkable how little high-quality data we have on the full lifecycle of births and family situations. Even straightforward questions like “controlling for education, does income or student debt correlate with fewer children?” are hard to answer.
One reason we end up using total fertility is that it is a very well-recorded event when children are born. You aren’t leaving the hospital after having kids until the Social Security documents are filled out. Births are logged immediately, and the age of the mother is a clean, consistent datapoint. Interviewing women later in their lives about how many children they’ve had (as Census does here) is a completely different, and more difficult, exercise.
One genuinely bipartisan effort would be to expand and strengthen the CPS Fertility Supplement. We could make it more regular, more in-depth, and add questions the experts studying this think would be helpful. But right now, sadly, the Bureau of Labor Statistics is under political assault, exactly when we need this data to be better, not worse.
Conclusion
For anyone who wants the United States to keep growing, 1.92 children is below the replacement level of 2 or 2.1. The shift to later parenthood carries real tradeoffs, which will reshape family life and intergenerational ties for both individuals and society. And this analysis is specific to the United States.
But spending time in the data leaves me less alarmist than the prevailing rhetoric. The shift in births is recent and likely shaped by shocks like the Great Recession and technology. The shocks are common across countries, and that means there is real policy space to act. We could begin by not wrecking the economy in service of the crudest mercantilist fantasies. But my new take is, instead of framing declining birth rates as a civilizational crisis, we would be better served by focusing on the concrete, near-term barriers facing people in their late 20s and early 30s.
As a 41 year old with one kid born prepandemic and not a second maybe a little bit because of the experience of raising a toddler durning the pandemic I’m surprised you didn’t discuss that more- or the effect of the millennials who did or didn’t manage to buy a house before rates went up. I expect those to influence some people to not have kids or to have fewer. I don’t think I know a representative sample - especially of 34 year olds but it seems likely that those are the effects that shifted from the 10s talk of tech workers freezing eggs to the natalism that started coming up postpandemic.
In figures 4 and 5, the convergence of the lines is aided by a noticeable *drop* (not just flattening) in completed fertility among the oldest cohort (1980). Does this imply that women in that cohort suddenly had many children die? I could be misunderstanding the import here, but it looks strange to see such a drop.