
The Cross-Section of Non-Citizens and the Job Slowdown
Sub-industries with the most non-citizen workers are behind the jobs collapse, the recent rebound, and the wage deceleration.

Average private sector job growth was 85,000 a month in 2024. That fell to 25,000 in 2025. Here’s a question: of a list of 250 notable private sector sub-industries tracked by economists, which had the biggest slowdown in job growth between those two years? I’ll give you the answer halfway through this post.
The main explanation is that net immigration collapsed. Job growth fell dramatically even as the unemployment rate remained roughly steady. Two new major papers from both the Dallas Fed and the Federal Reserve argue that break-even job growth may even be around zero now because of this decline in immigration.
These analyses generally work by projecting population growth, participation rates, and unemployment, then multiplying them together. They’re important studies and they’re difficult to get right because they depend on the unknowable future of population growth and the unknowable present of steady levels of unemployment and participation. But one thing I’ve seen less of in real-time is the cross-section of immigration and job growth. Immigrants aren’t scattered randomly across job categories. What can we see of their evolution in the monthly data?
This is a quick pass, designed to put some methods into play and spark debate. On this first glance, we can see the expected collapse in job growth for industries with high levels of non-citizen workers. But additional things jump out. The recent rebound in employment numbers over the past several months looks to be driven by this group of industries. Yet the wages for workers in these industries slowed among the fastest, the opposite of what conservatives were hoping would happen.
Methods
We bring in three things here1:
First, the diffusion index from the Current Employment Statistics (CES). This is a set of 250 sub-industries that together comprise nearly 100% of private-sector employment, giving us a broad cross-section of job growth. Since CES is a survey of businesses, we get good numbers on employment level and changes, as well as their own detailed industry code (NAICS). But as a result, we don’t know anything about the workers (except their gender).2
Second, citizenship status from the Census’s American Community Survey (ACS). The ACS collects citizenship status and provides its own NAICS code. We pull the 2024 1-Year ACS Public Use Microdata straight from the Census website. From that, for every available NAICS code, we calculate the percent of workers who are not citizens.
Third, we then match those NAICS codes with non-citizen percentages to the CES NAICS industries in a crosswalk algorithm that tries to match the industries with as much specificity as possible.3 If there’s an error in this analysis or if it is fundamentally misguided, it happens in this step. The match isn’t perfect but it works reasonably well. Of the 250 industries, 136 match at the 4-digit NAICS level, 98 at 3-digit, and 15 at 2-digit, for a total of 249 matches out of 250. The one notable issue is construction, which only shows up once in the ACS at the highest aggregation level. So the 10 construction sub-categories in the diffusion index for jobs data all get the same high non-citizen share of 19%.
The Census definition of non-citizen here broadly includes “temporary migrants (such as foreign students), humanitarian migrants (such as refugees and asylees), and unauthorized migrants.” A last methodological choice here is to keep all non-citizens, so it reflects those here legally and illegally. There is excellent work from the people at e.g. Pew that tries to disentangle legal versus unauthorized immigration levels. However, the Trump administration has revoked student visas and has targeted green card holders for deportation proceedings. For our exercise, the pressure campaign the administration has pushed on non-citizens here legally causes me to include the entire group.
The Slowdown
With that in hand, we can plot each industry’s job growth slowdown against its non-citizen share. For each of the 249 industries, I compute average monthly job growth in 2024 and 2025, then take 2025 subtracting 2024, and put it on the y-axis. Negative here means the industry slowed down. X-axis is the percent of noncitizen workers.
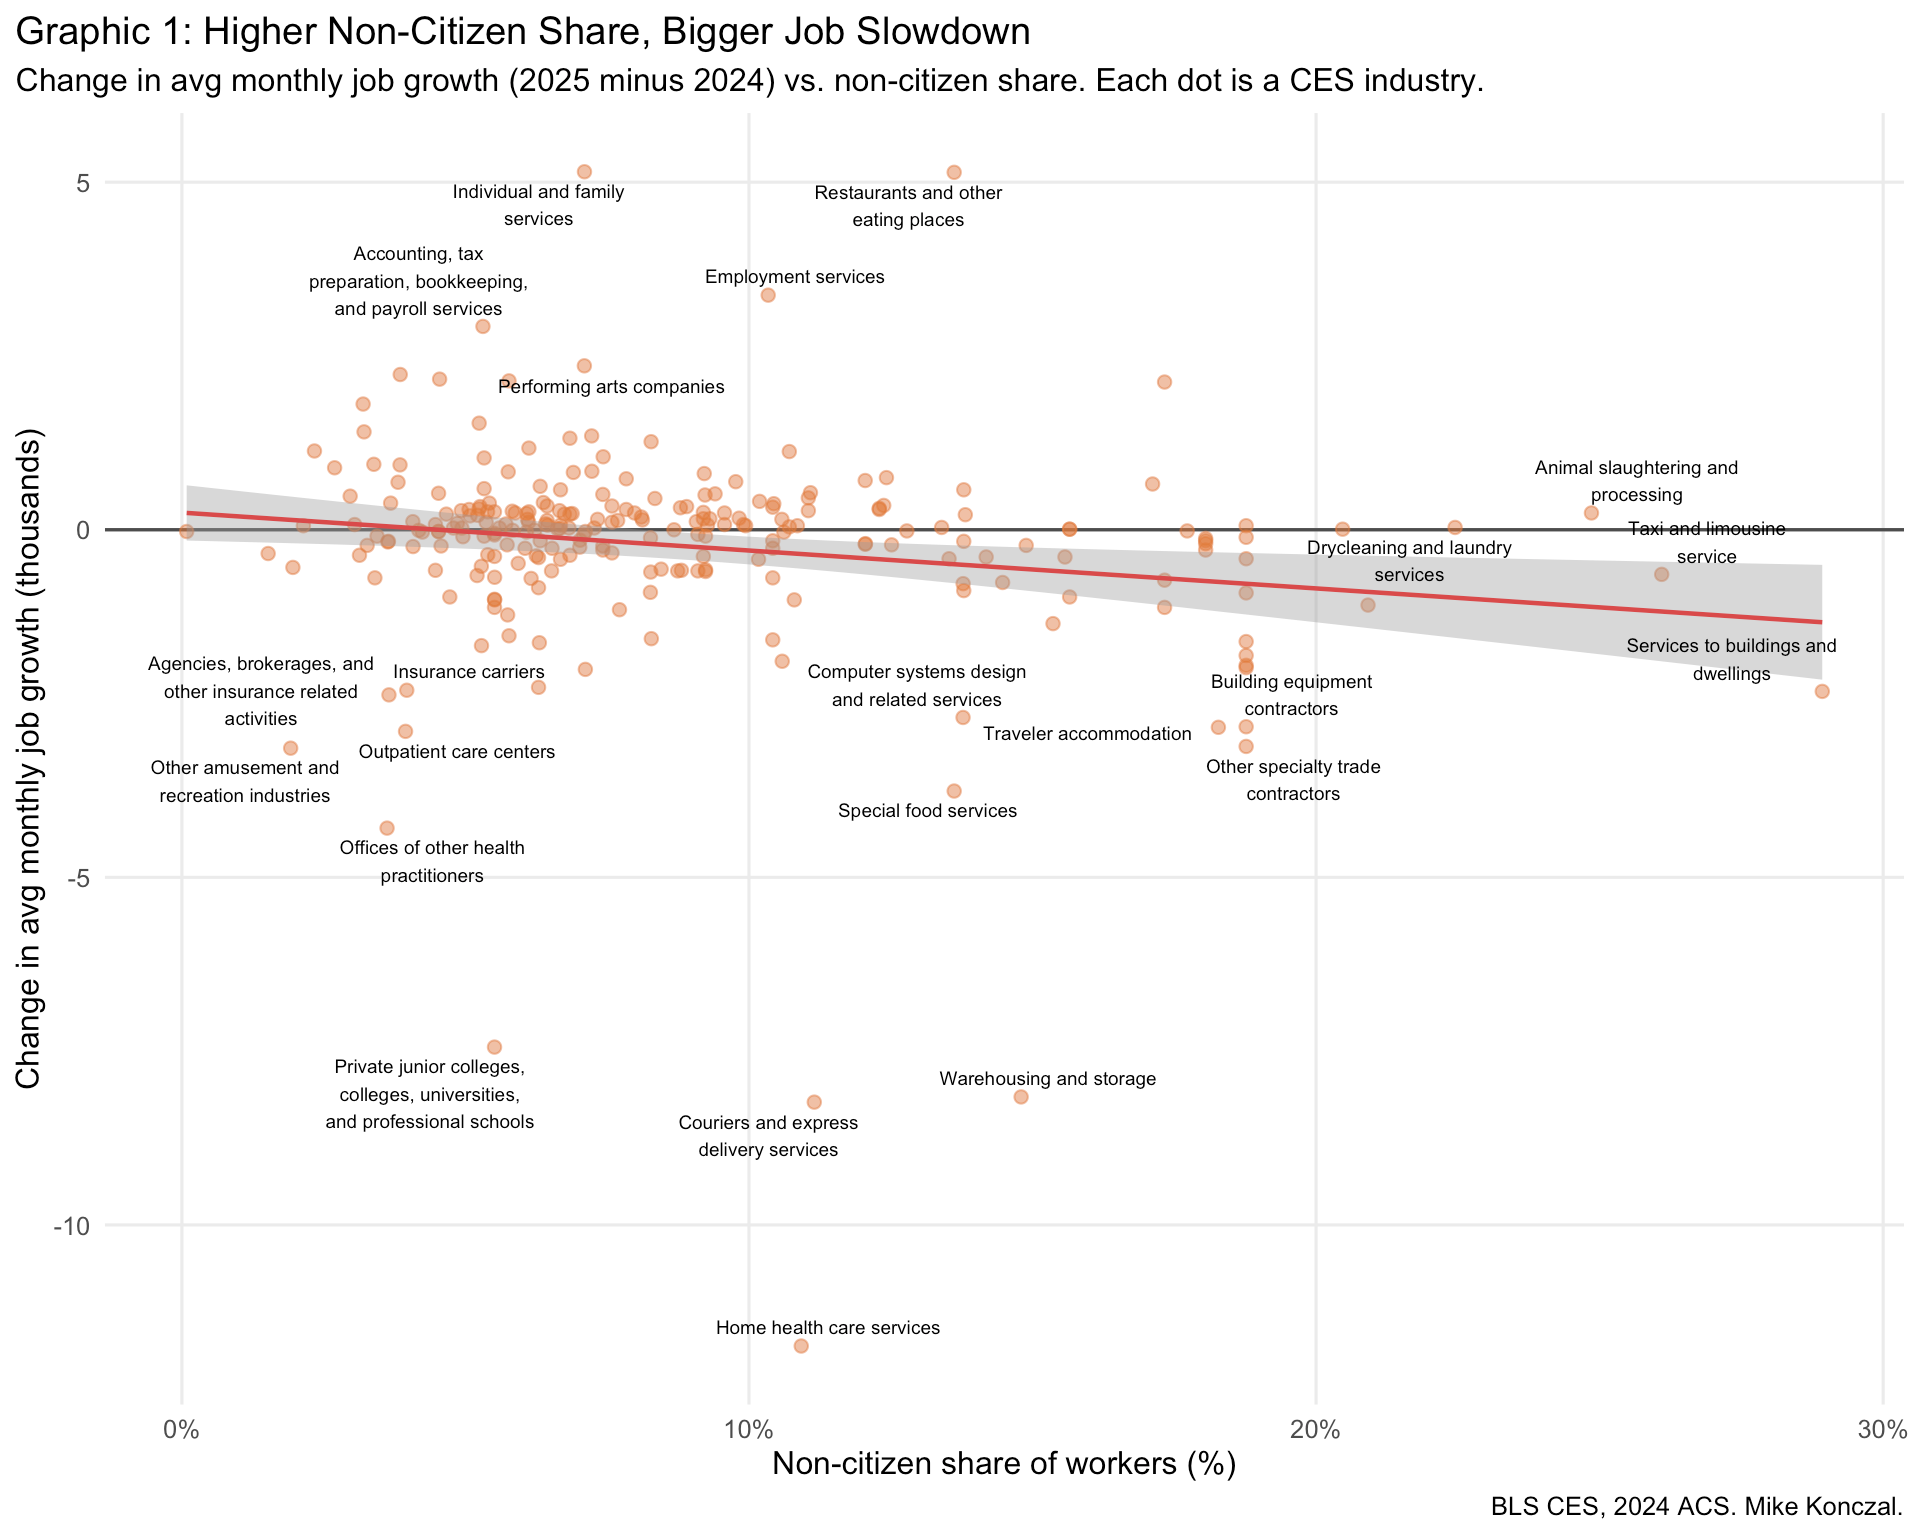
There’s a clear downward slope, and in particular at the right side of the distribution it’s basically all negative. The industries with the most non-citizen workers nearly all slowed down. A regression is significant but has little R-squared explanatory power.
You can also see the industry we teased in the first paragraph, the one with the largest negative value on the y-axis. That’s home health care services, which went from 13,000 a month in 2024 to 1,000 a month in 2025.
Home health aides do work we know needs to be done. It won’t be automated or done with AI. It is labor-intensive. There’s no sense that immigrants contributing to it detract from national security or keep us from upstream innovation. As this excellent overview piece last December by Shannon Najmabadi at the Washington Post showed, home health care is getting squeezed by immigration restrictions, cuts to Medicaid and Medicare, and the growth of Medicare Advantage. What are we even doing here?
Slowdown, Then Speedup
I take the 249 matched industries and divide them into five quantile groups by non-citizen share.
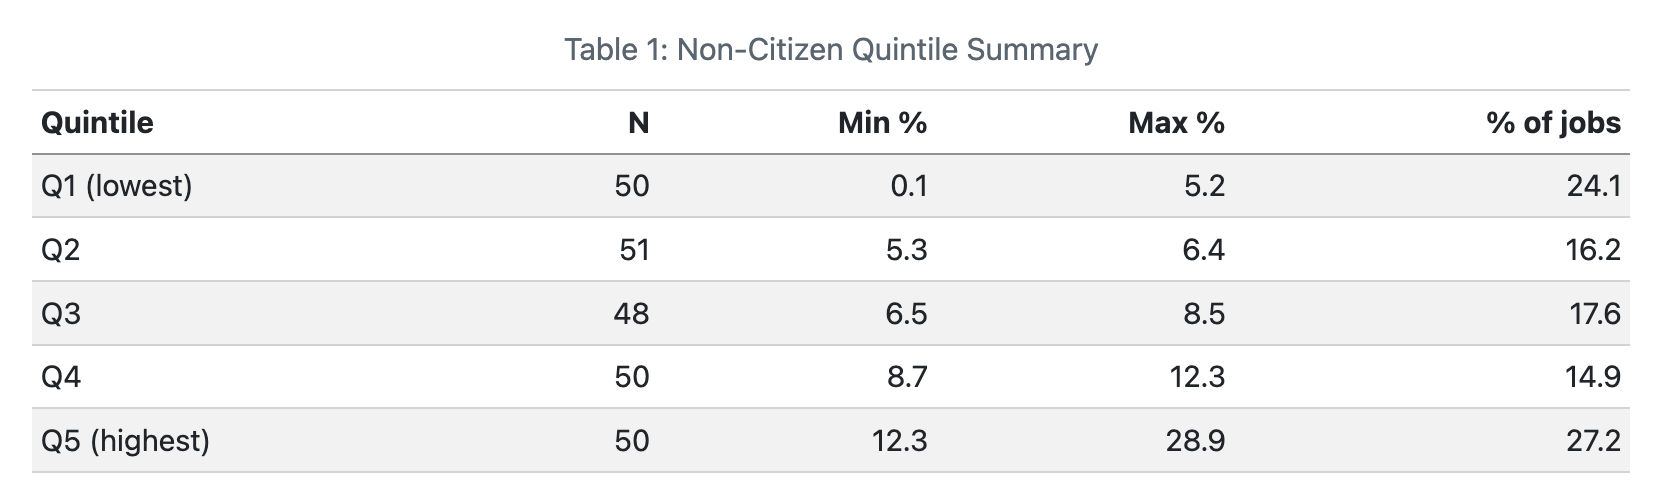
There’s a little lumpiness here at the top end, but I think we can proceed. Let’s make this clearer. What was the job growth in 2024 versus 2025 for those five categories?
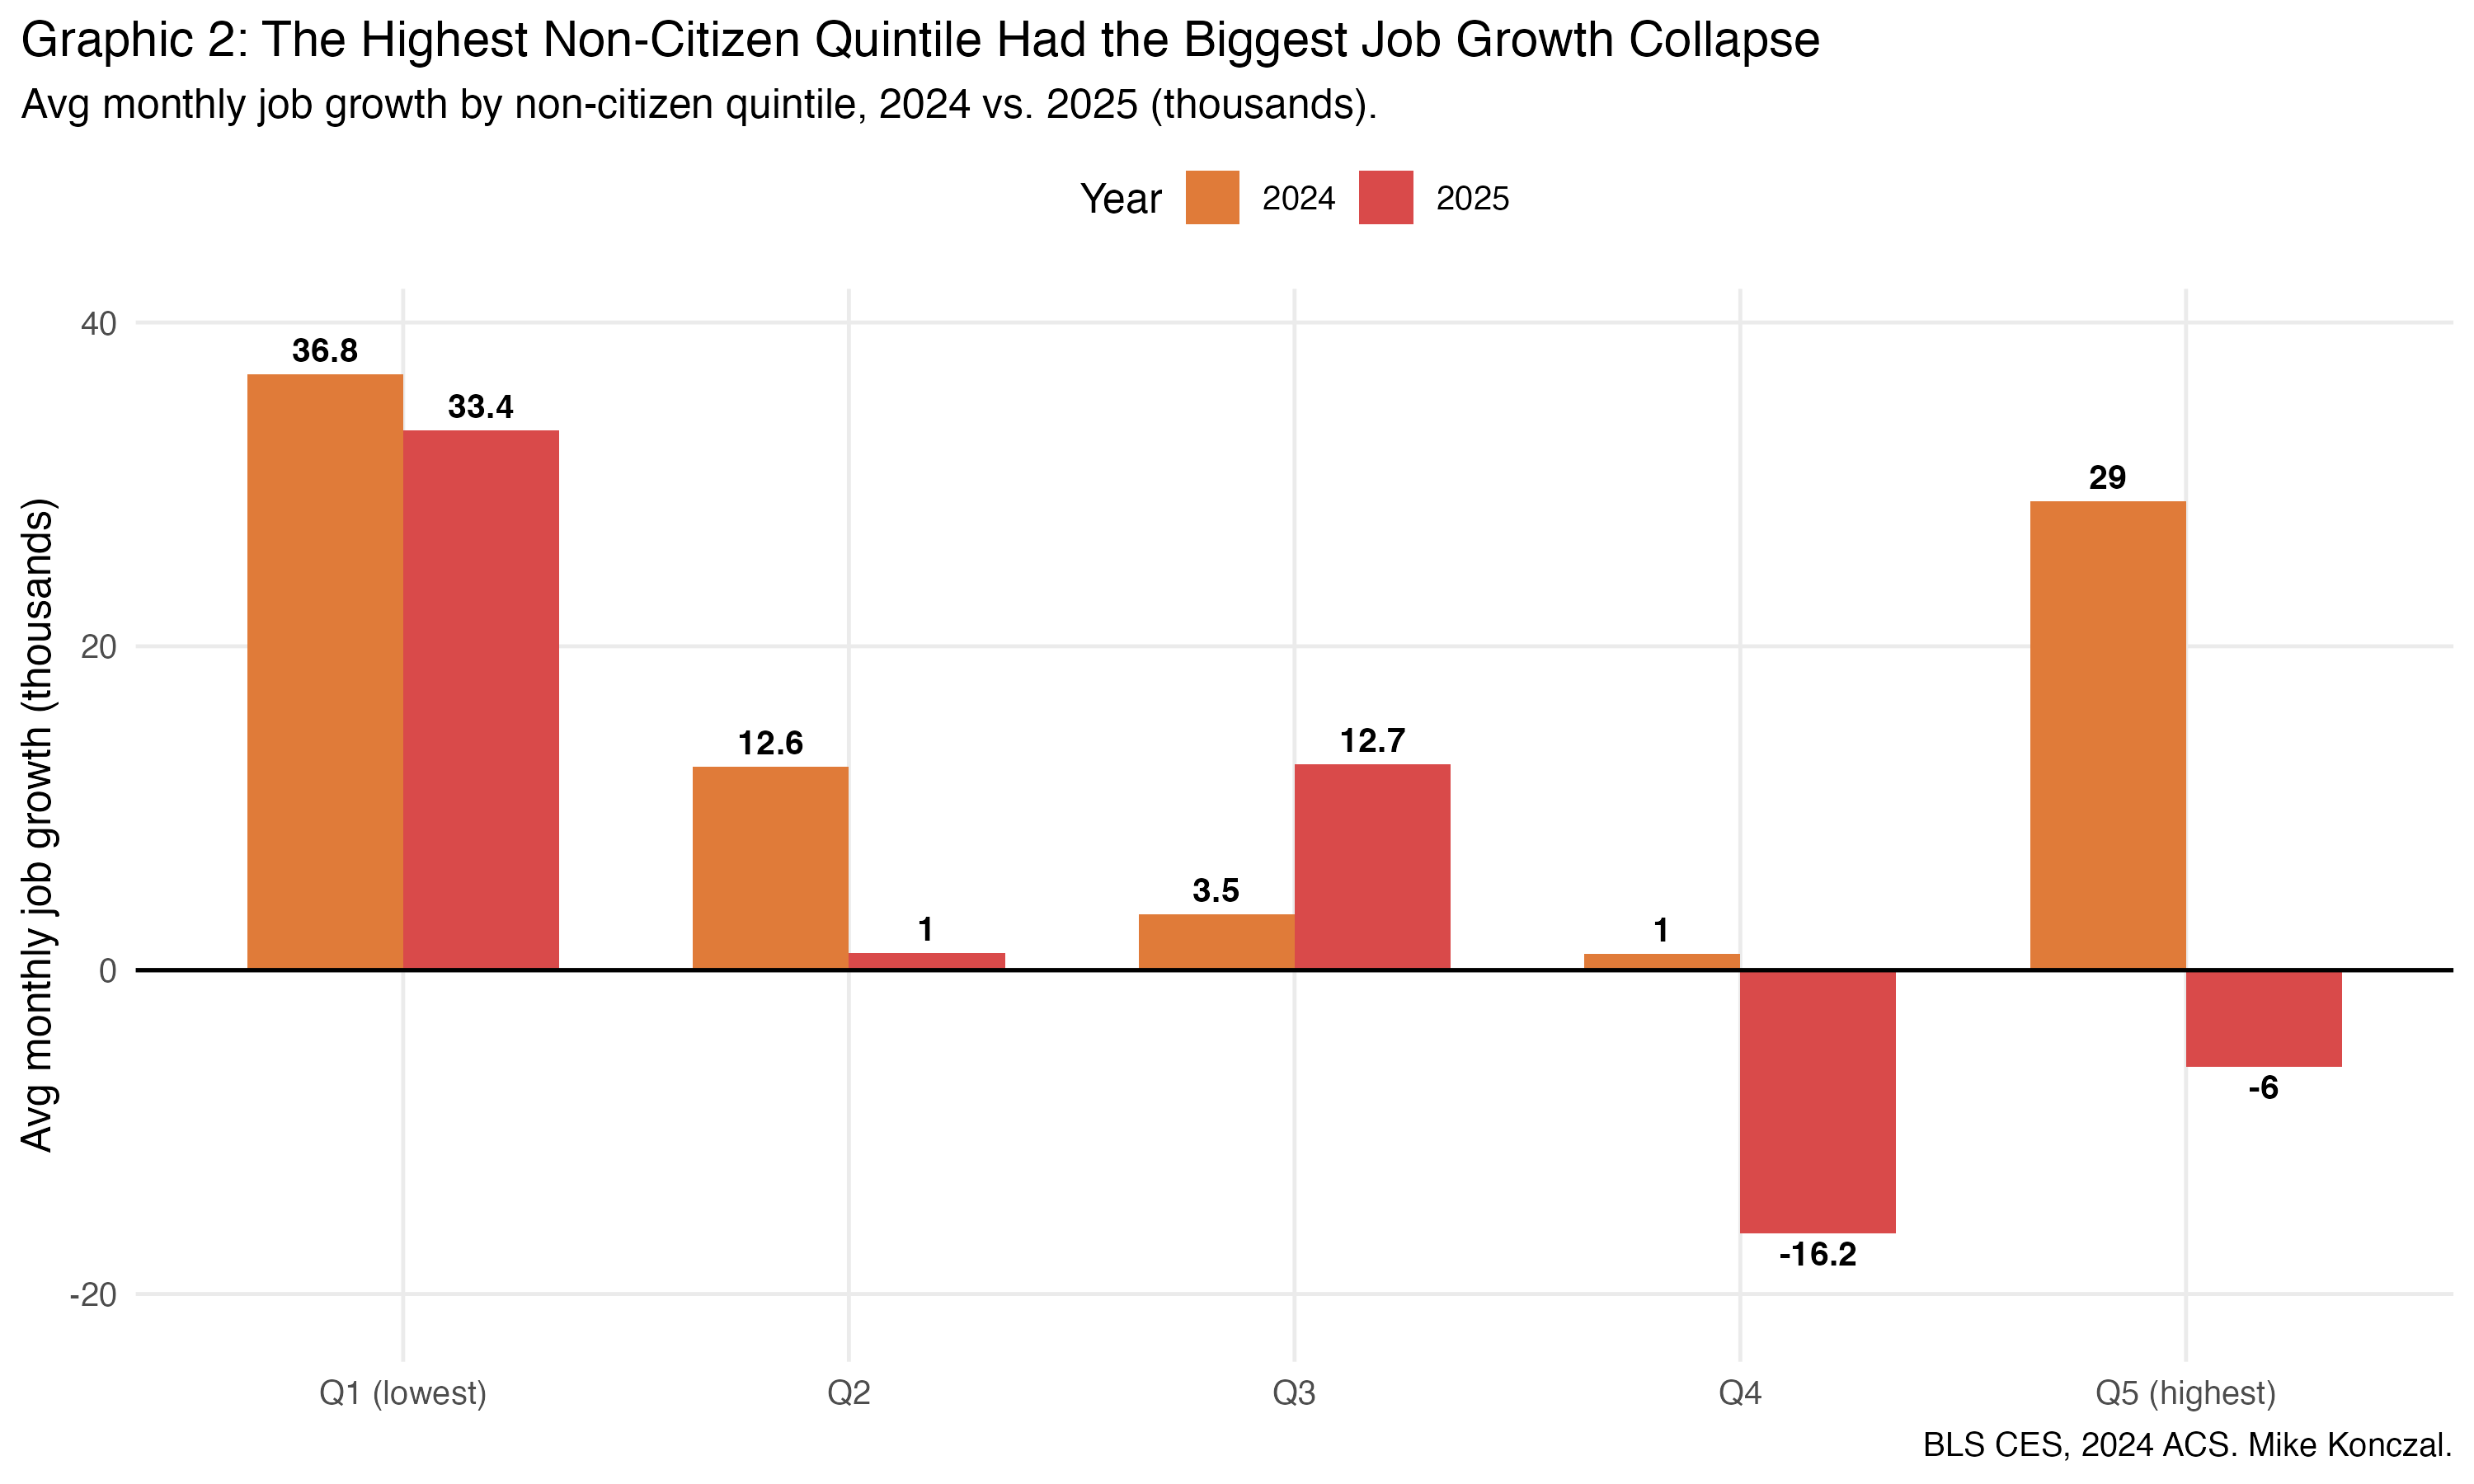
It’s the fifth quintile, with the highest percent of non-citizen workers, that has the biggest drop, from contributing 29,000 jobs a month in 2024 to -6,000 in 2025. There is a slowdown across the board, but Q5 stands out. What everyone assumes is happening actually shows up in the data.
How closely can we see a break early in 2025? And since last November, there’s been some pickup in job numbers; what’s driving that? To look into this, here’s 3-month average job growth for the five quintiles from 2023 through February 2026.
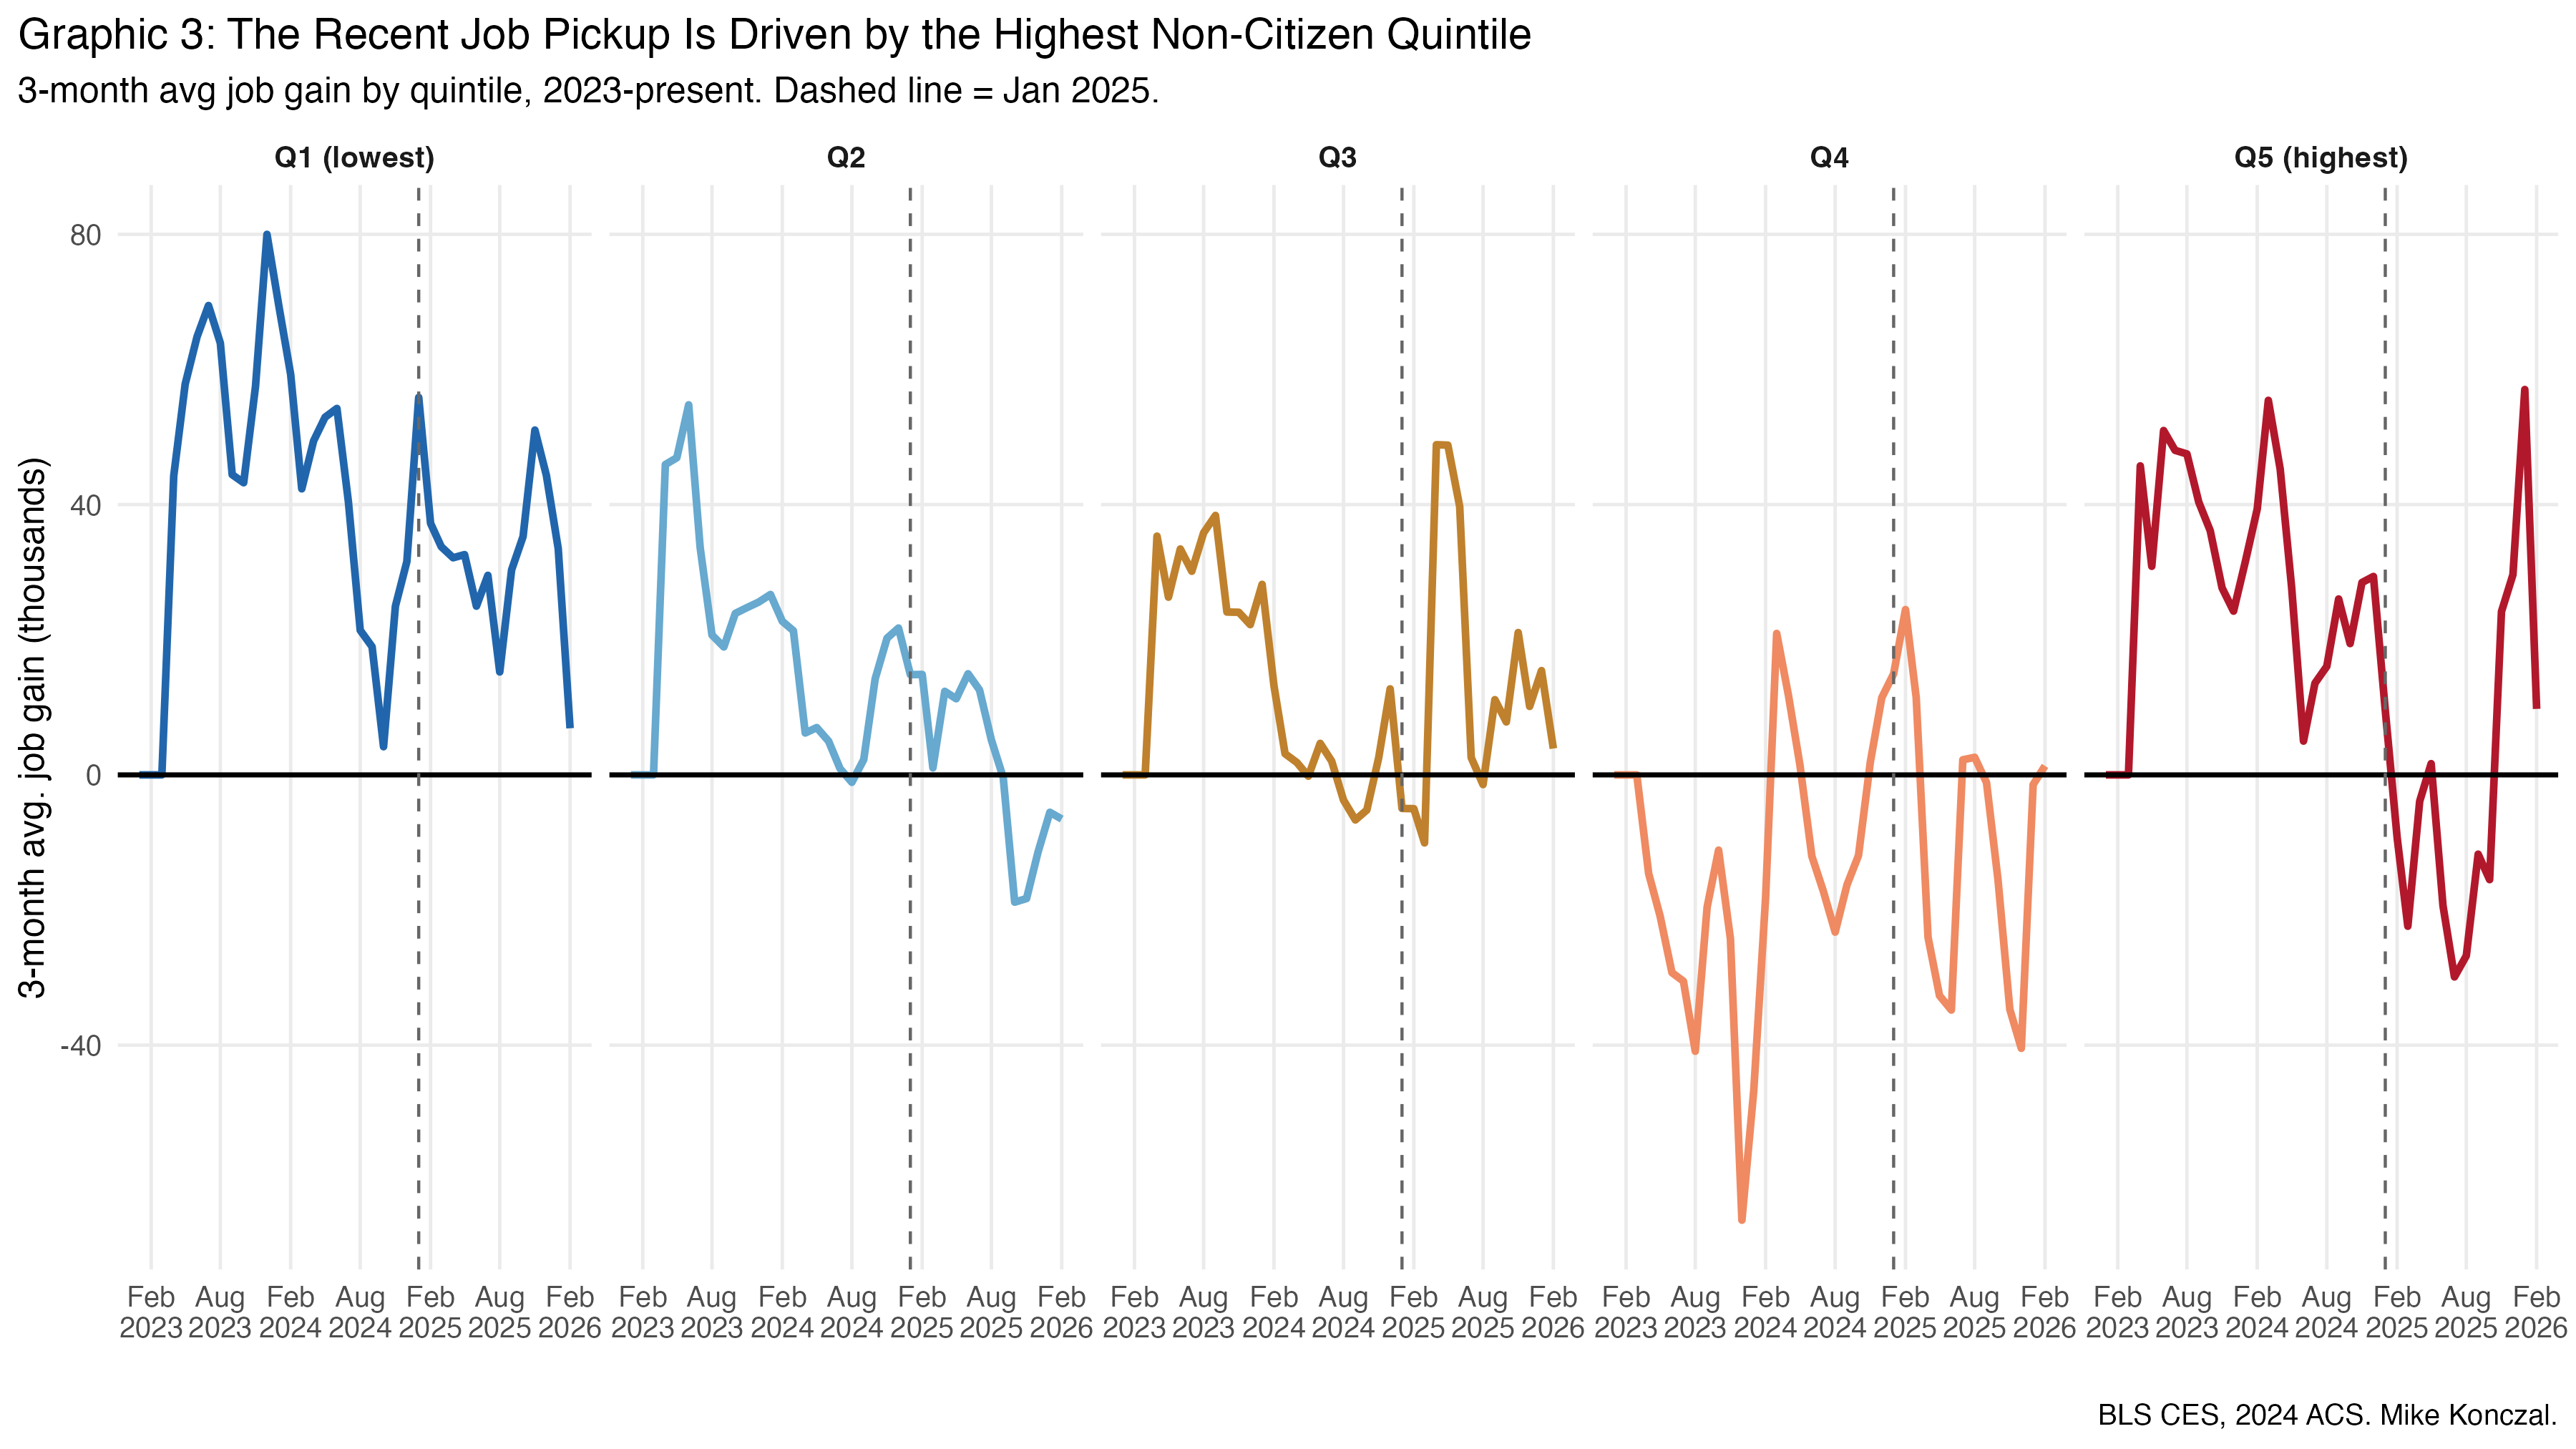
You can see this Q5 drop happening right as the Trump administration takes office. Yet the recent pickup is also mostly driven by the fifth quintile, the industries with the most non-citizen workers. Let’s redo the comparison above but add a third bar for average monthly growth since last October.
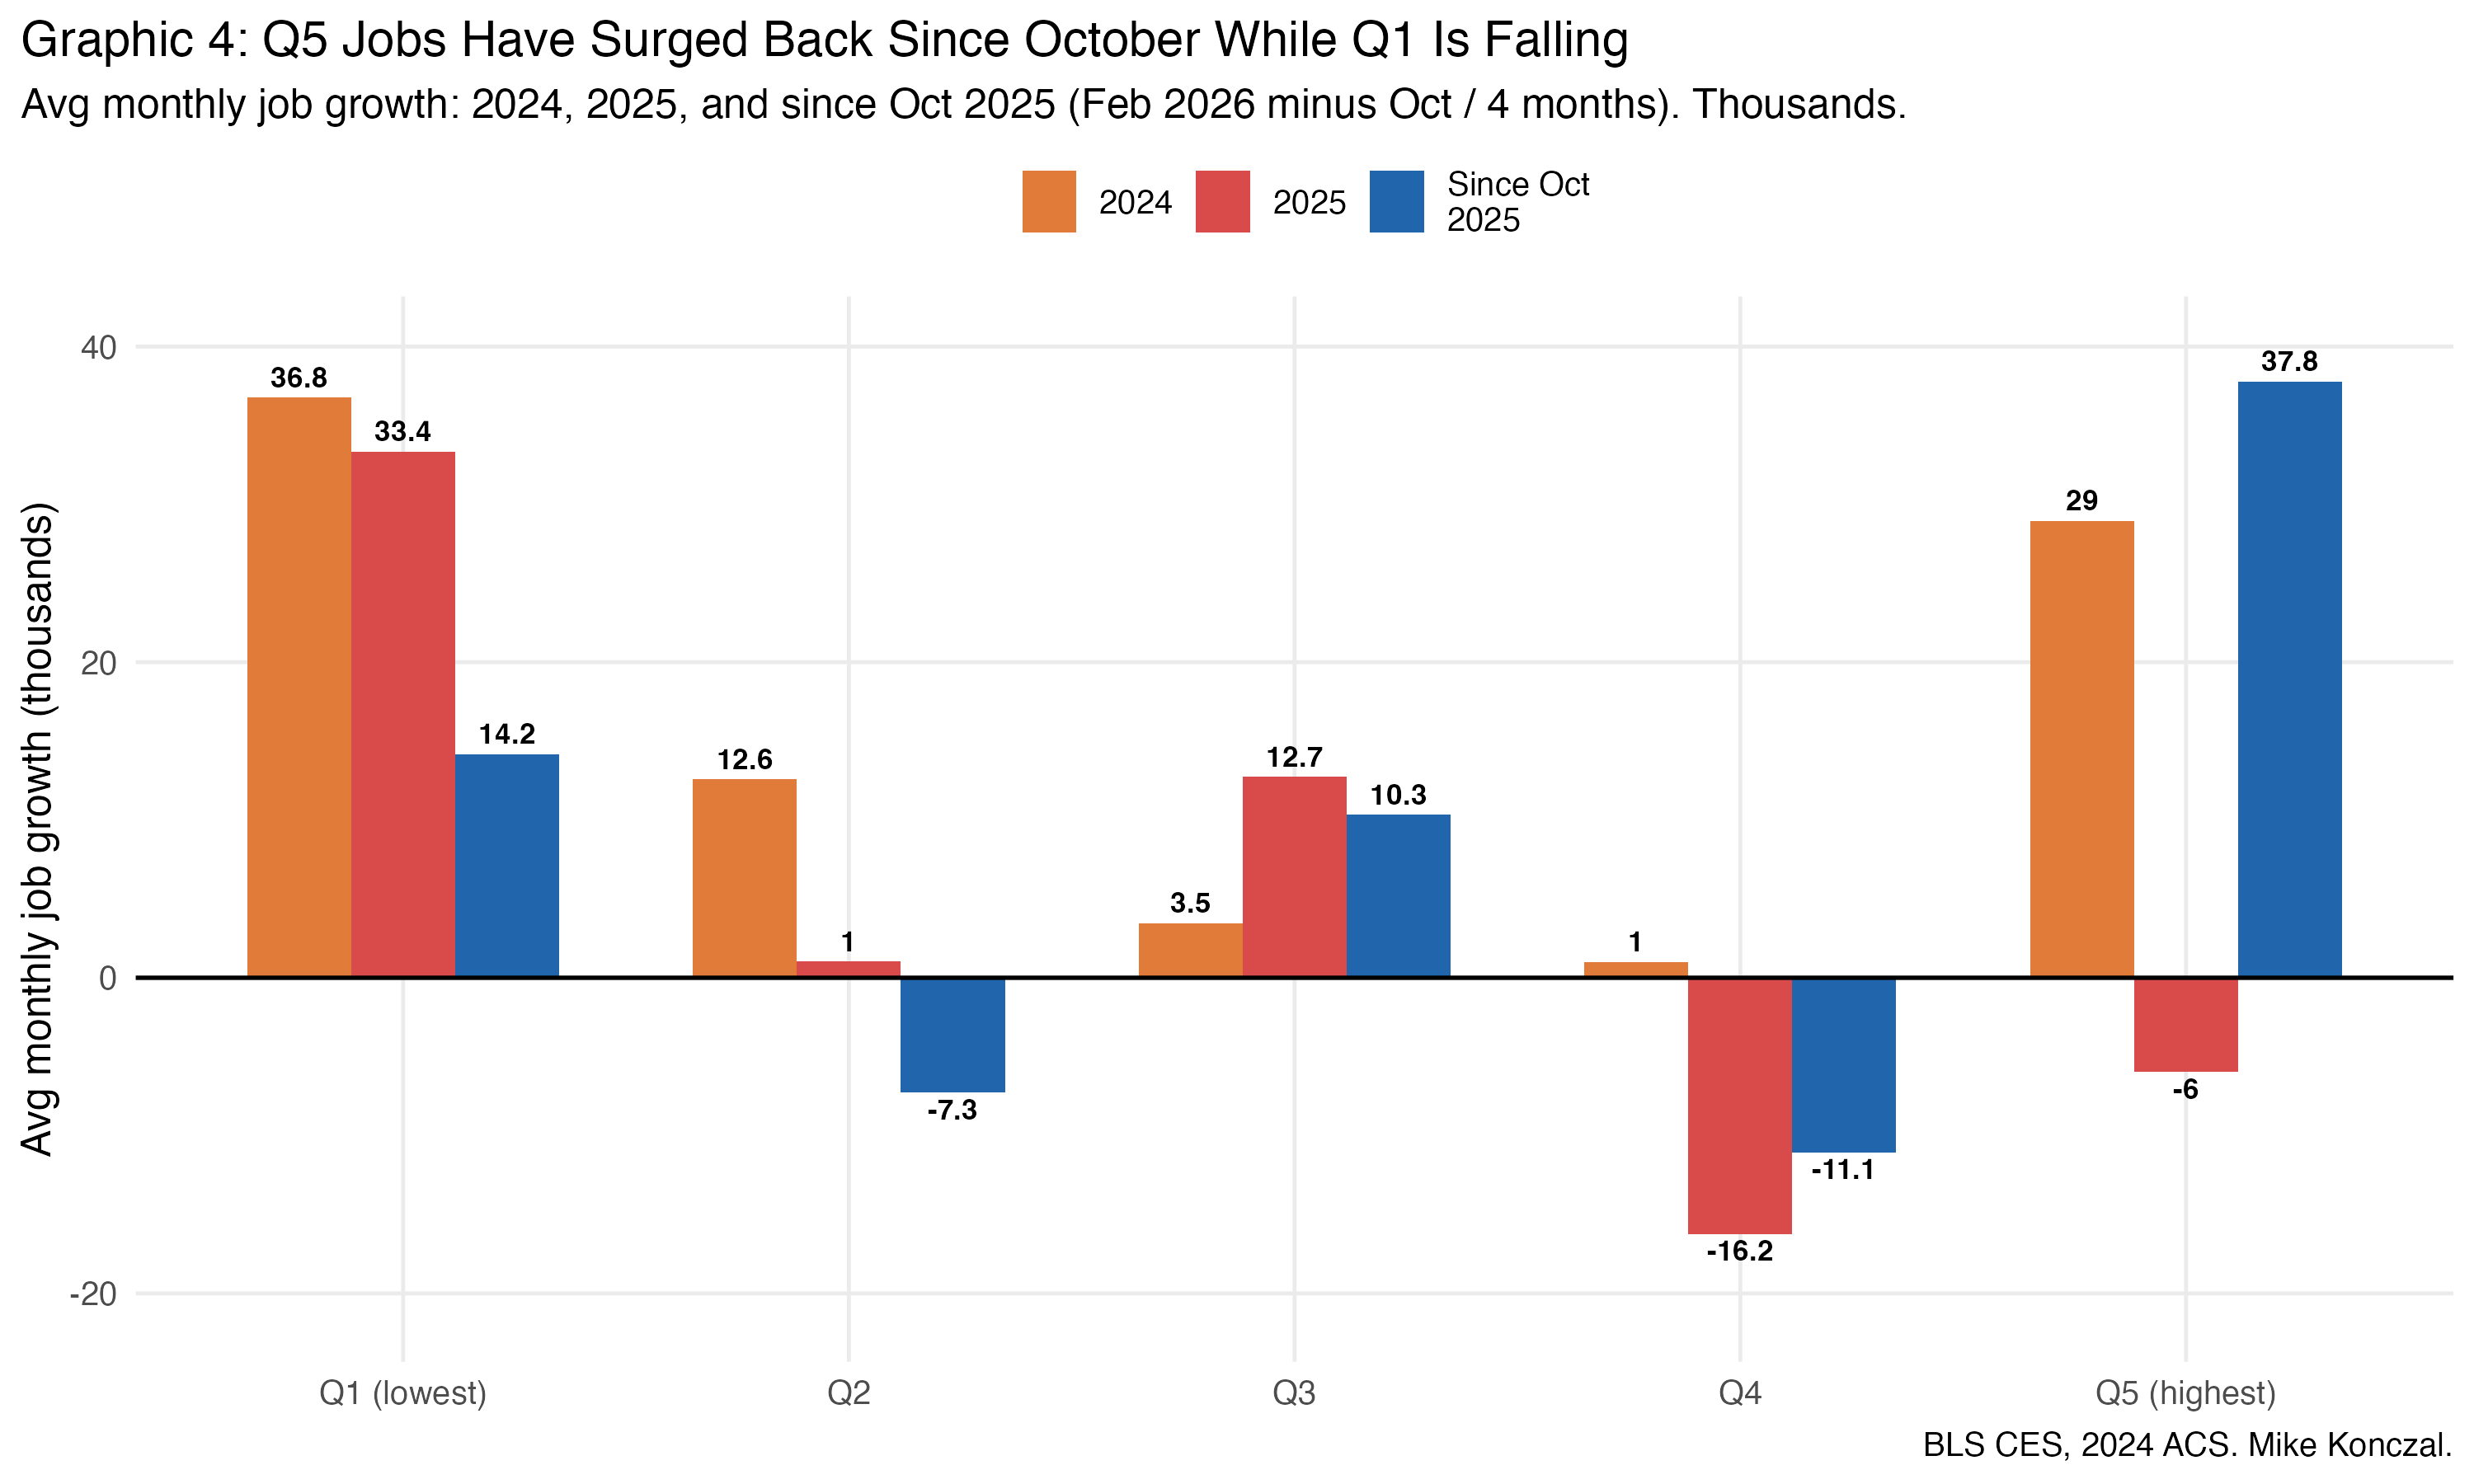
There’s a big shift. Q5 jobs have surged since October while jobs in Q1 are actually falling. What do we think is happening here?
When you’re looking at data this granular, you have to be careful about over-interpreting what could be random noise in small categories. So I create a breadth measure for Q5: the percent of Q5 industries with positive 3-month average job growth.
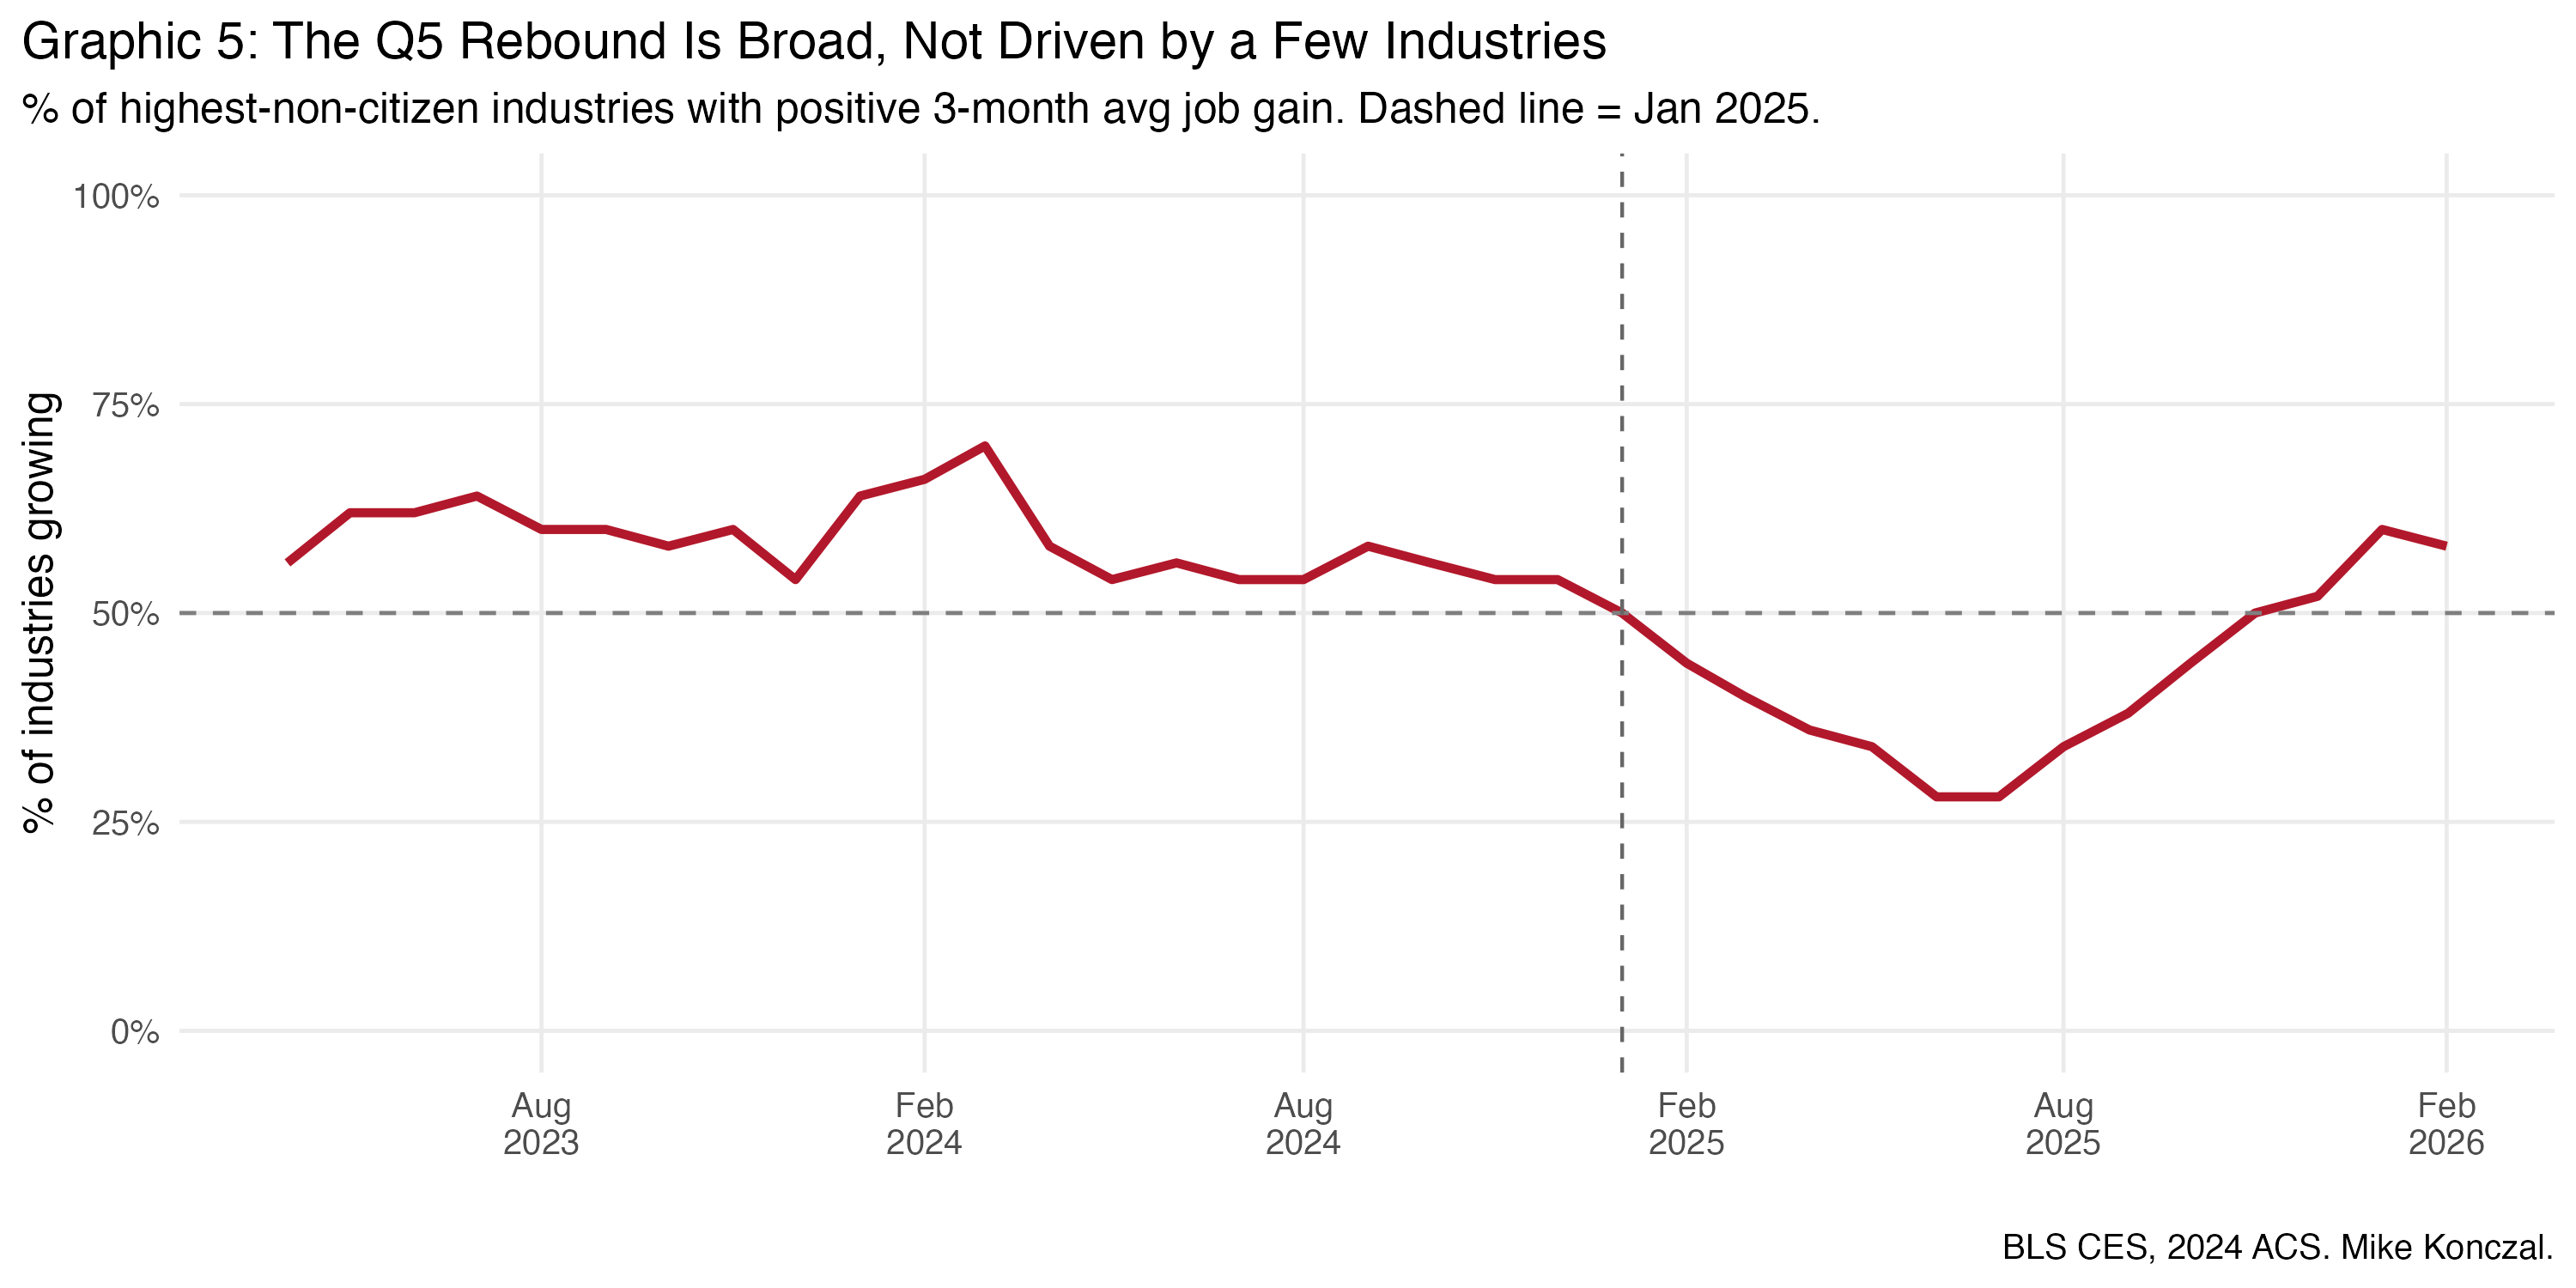
It’s actually picked back up to old, broader, levels. So the recovery is fairly broad-based across Q5 industries, not just a few big movers.
What Isn’t Happening: Wages
There are several possible explanations, but let’s get one out of the way. I don’t think the Q5 pickup is explained by workers being pulled over from Q1 industries, which are declining. Q5 industries pay about $32/hour on average versus $43/hour in Q1. I also don’t think it’s workers being pulled into the labor force because we don’t see it in the native-born employment-to-population data, which is shrinking.
If employers in high-non-citizen industries were bidding up wages to attract replacement workers from other sectors, we should see wage acceleration in Q5. Here’s what we see, with both nonsupervisory and total wage growth in Graphic 6-7 and 8 respectively:
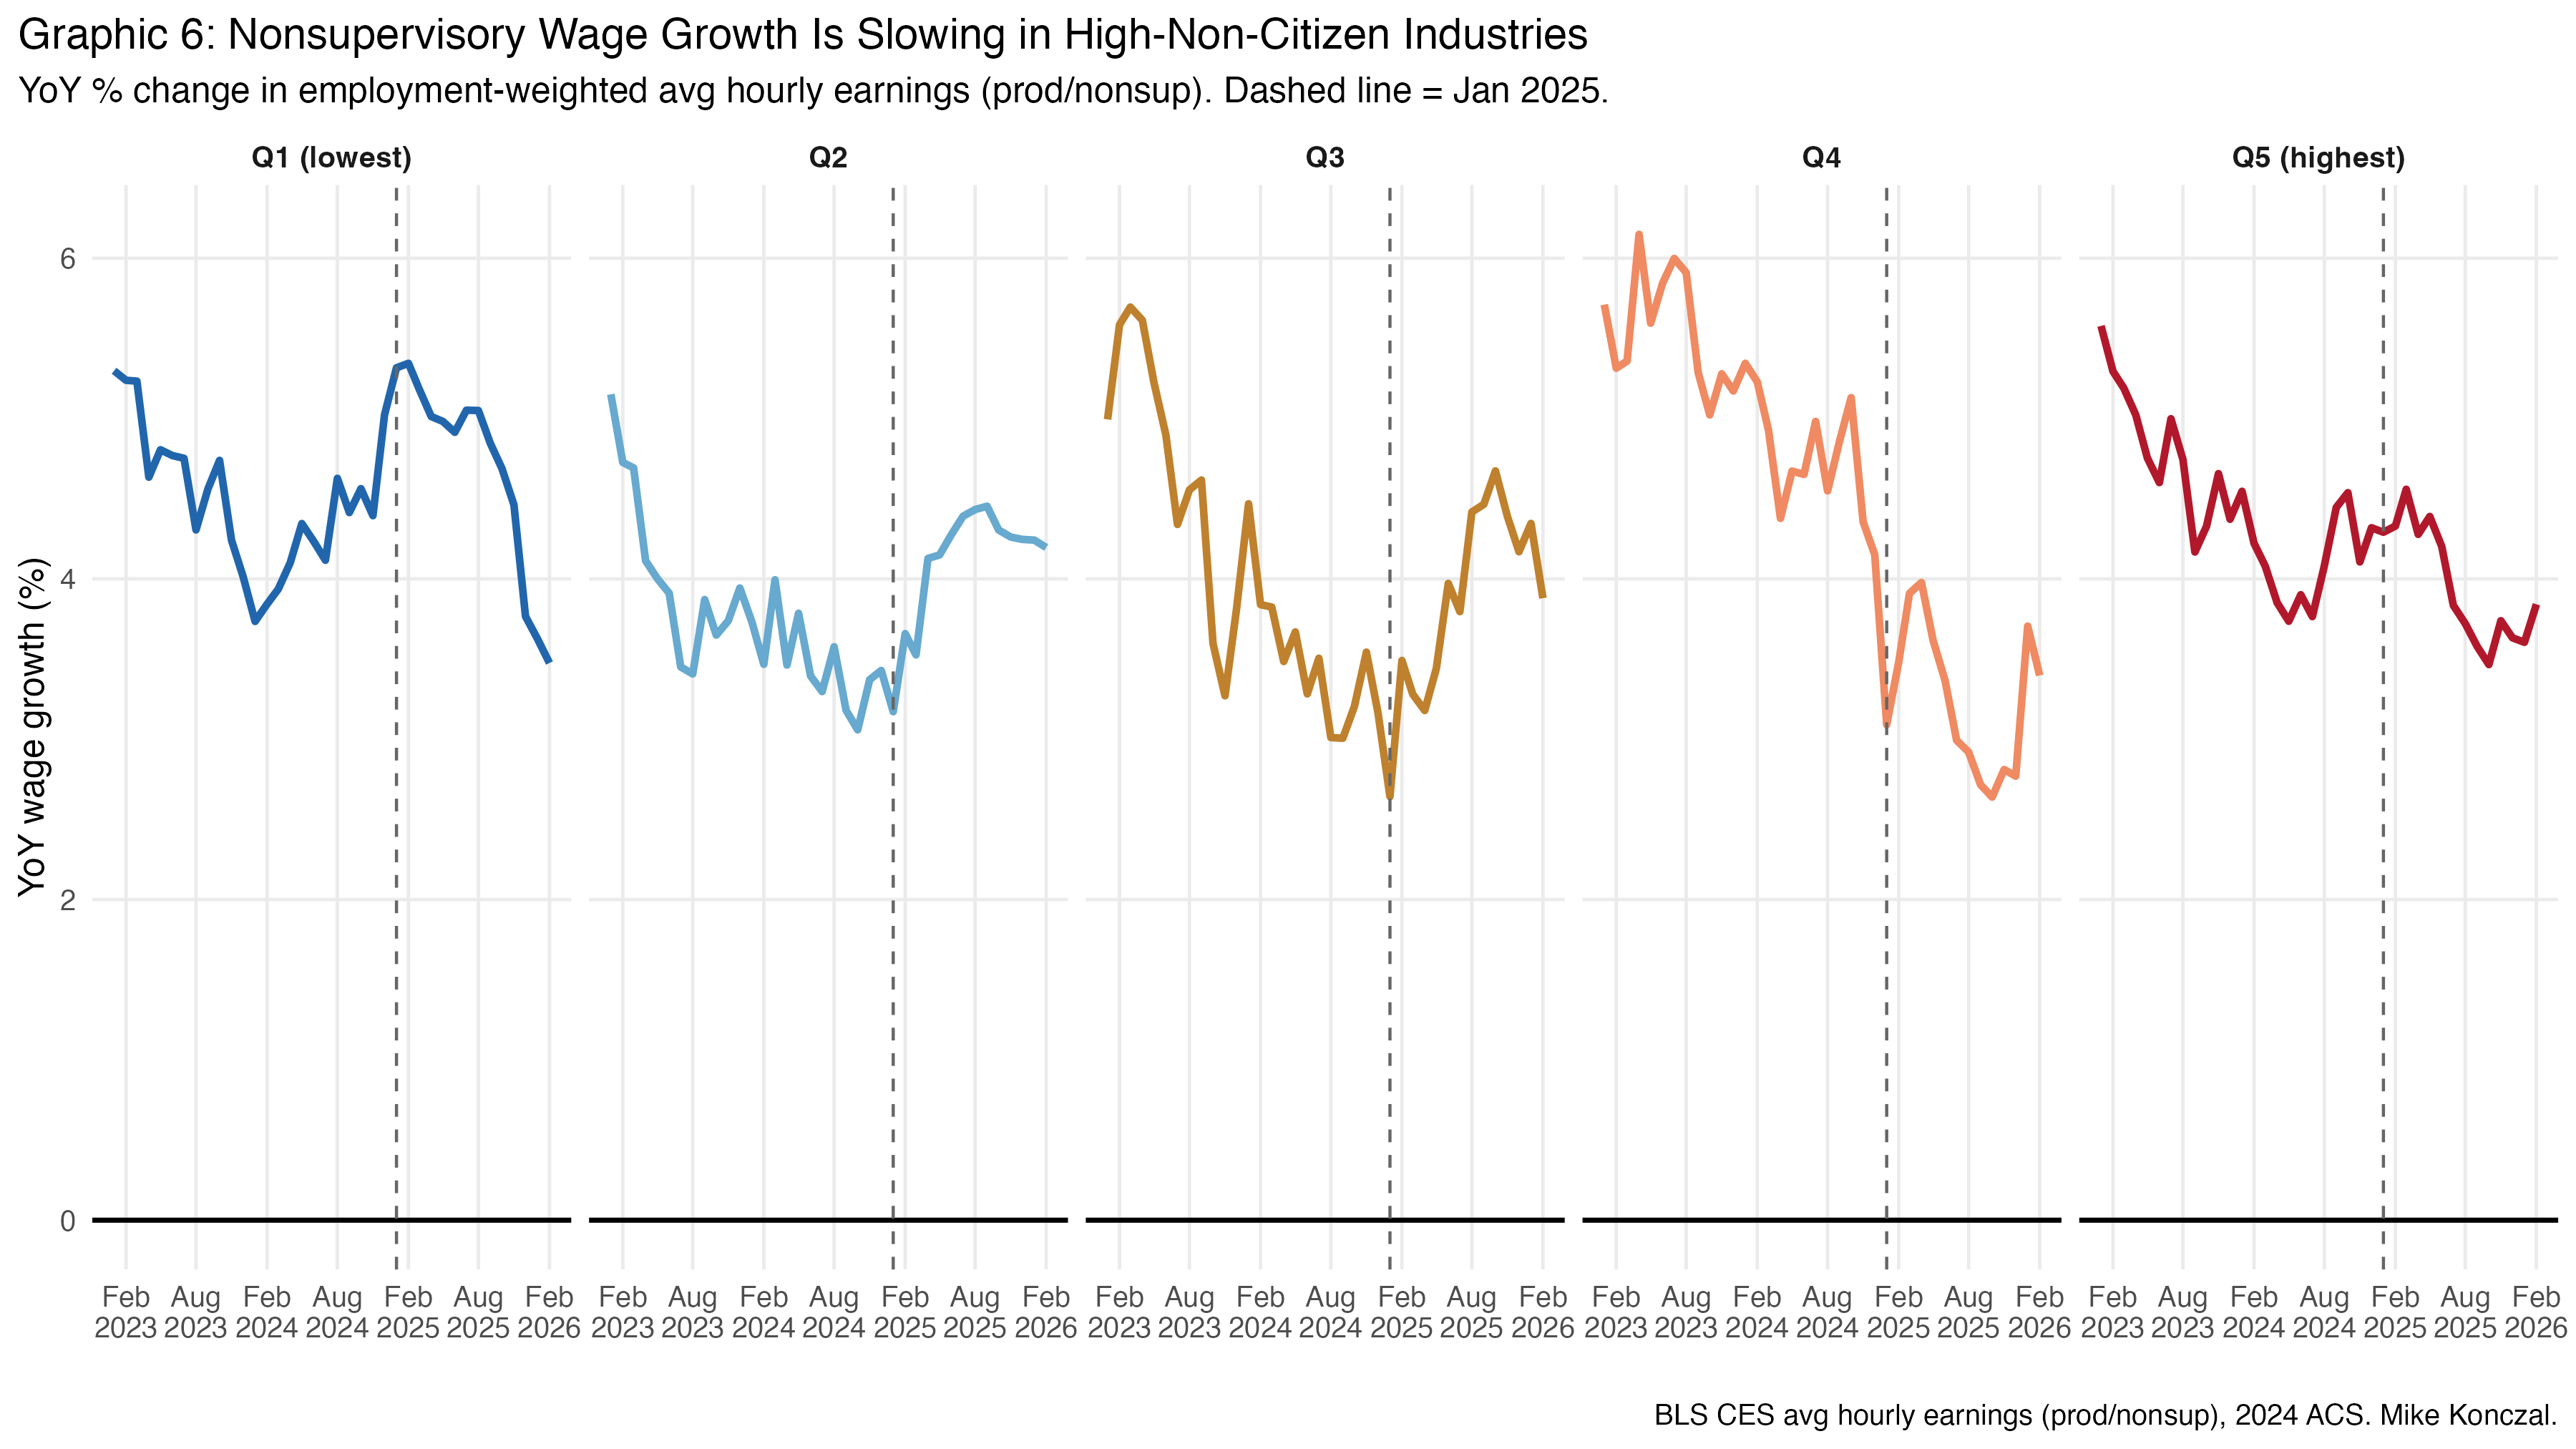
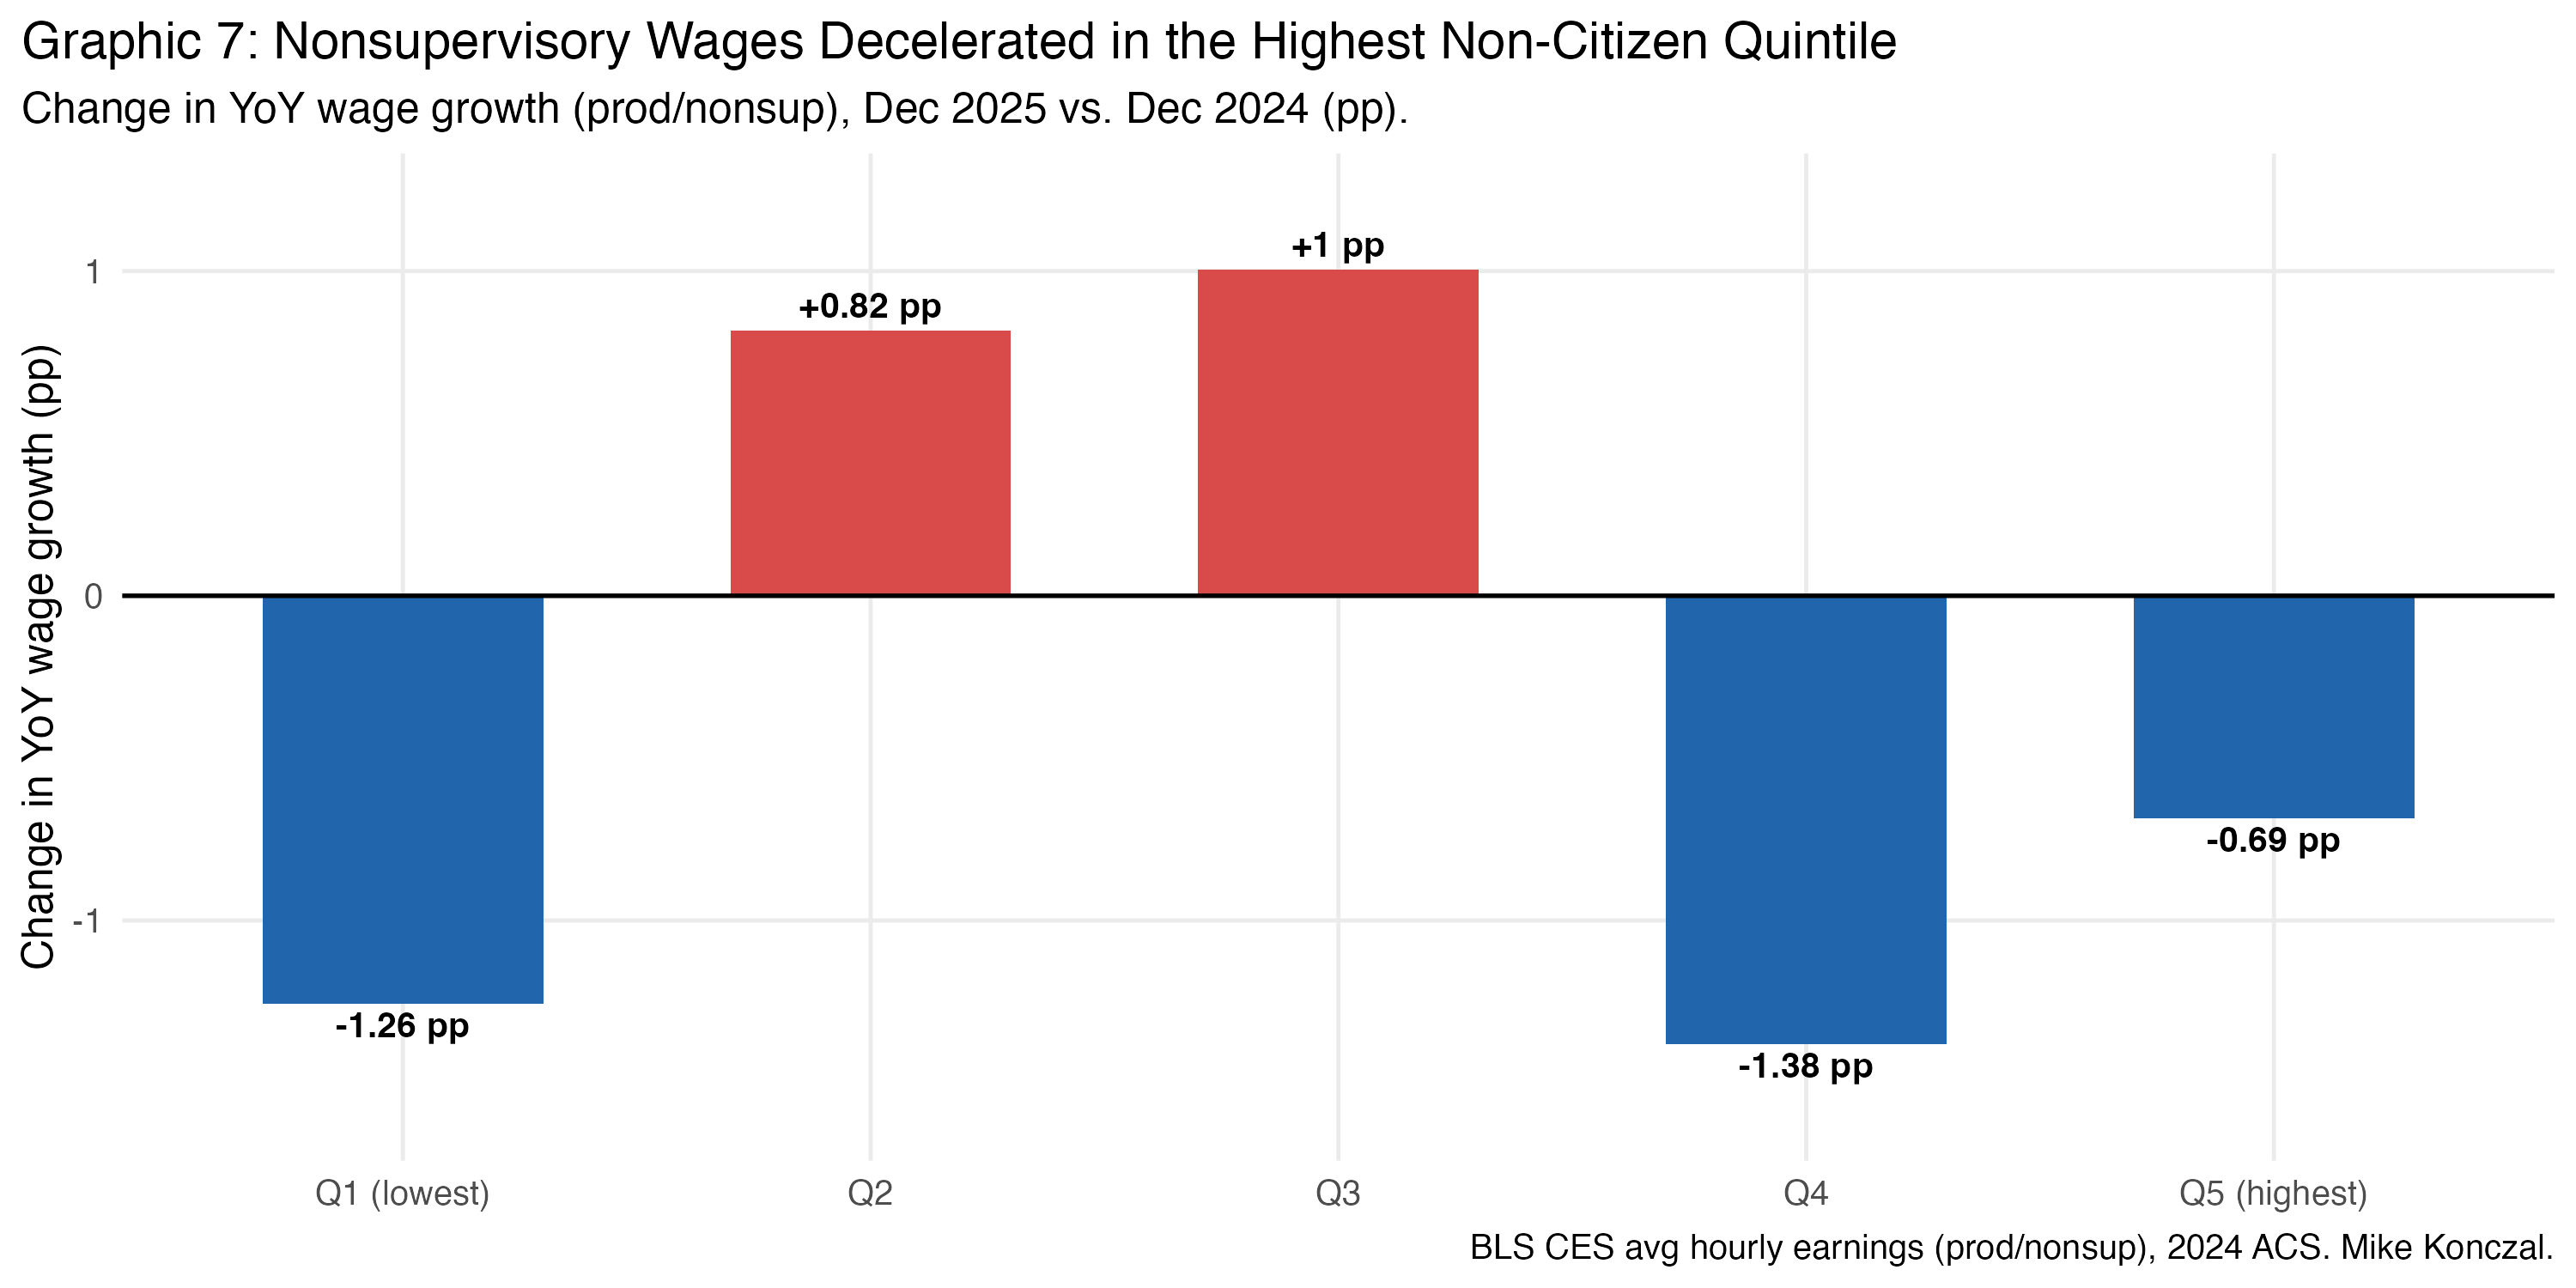
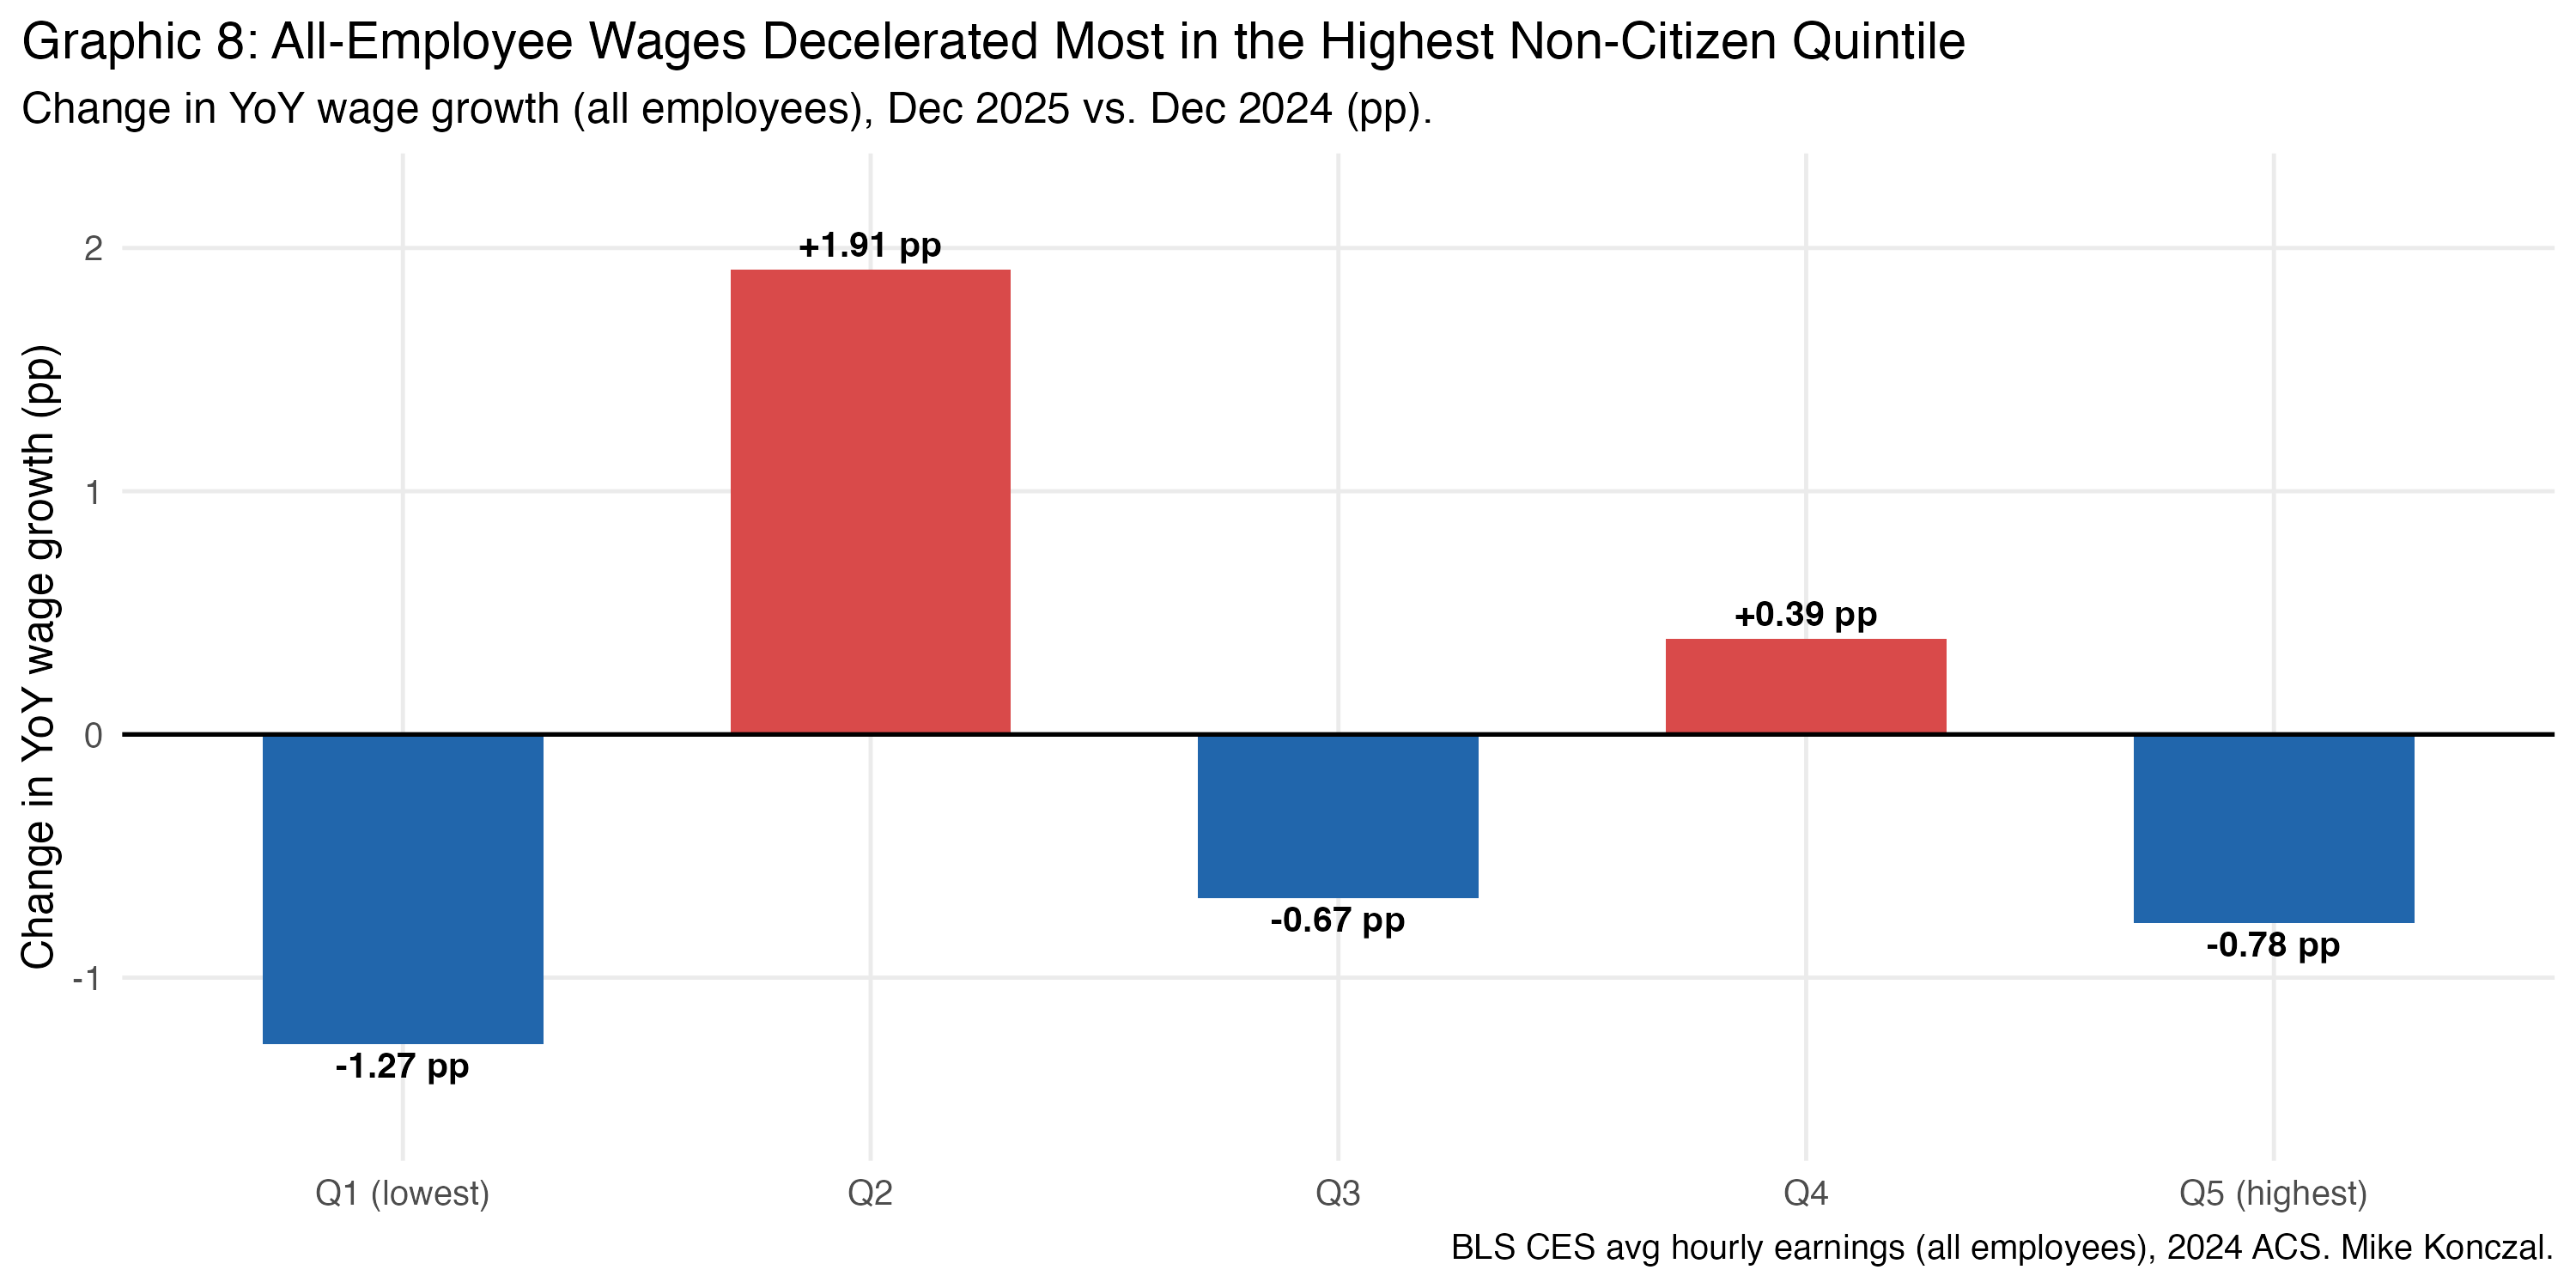
Q5 nonsupervisory wage growth decelerated by 0.69 percentage points. This is even more driven by Q5 for all-employee wage growth. This is true if we use fixed-weights to deal with compositional issues as well. Friend of the Substack Matthew Klein has also noticed a weird wage divergence among industries; perhaps this is part of the explanation.
Jobs decreasing and wages slowing at the same time is something we’d normally associate with a negative demand shock. But that doesn’t obviously characterize what’s happened with the step-up in immigration enforcement. To check if a negative demand shock is in play, we look at average weekly hours for nonsupervisory workers:
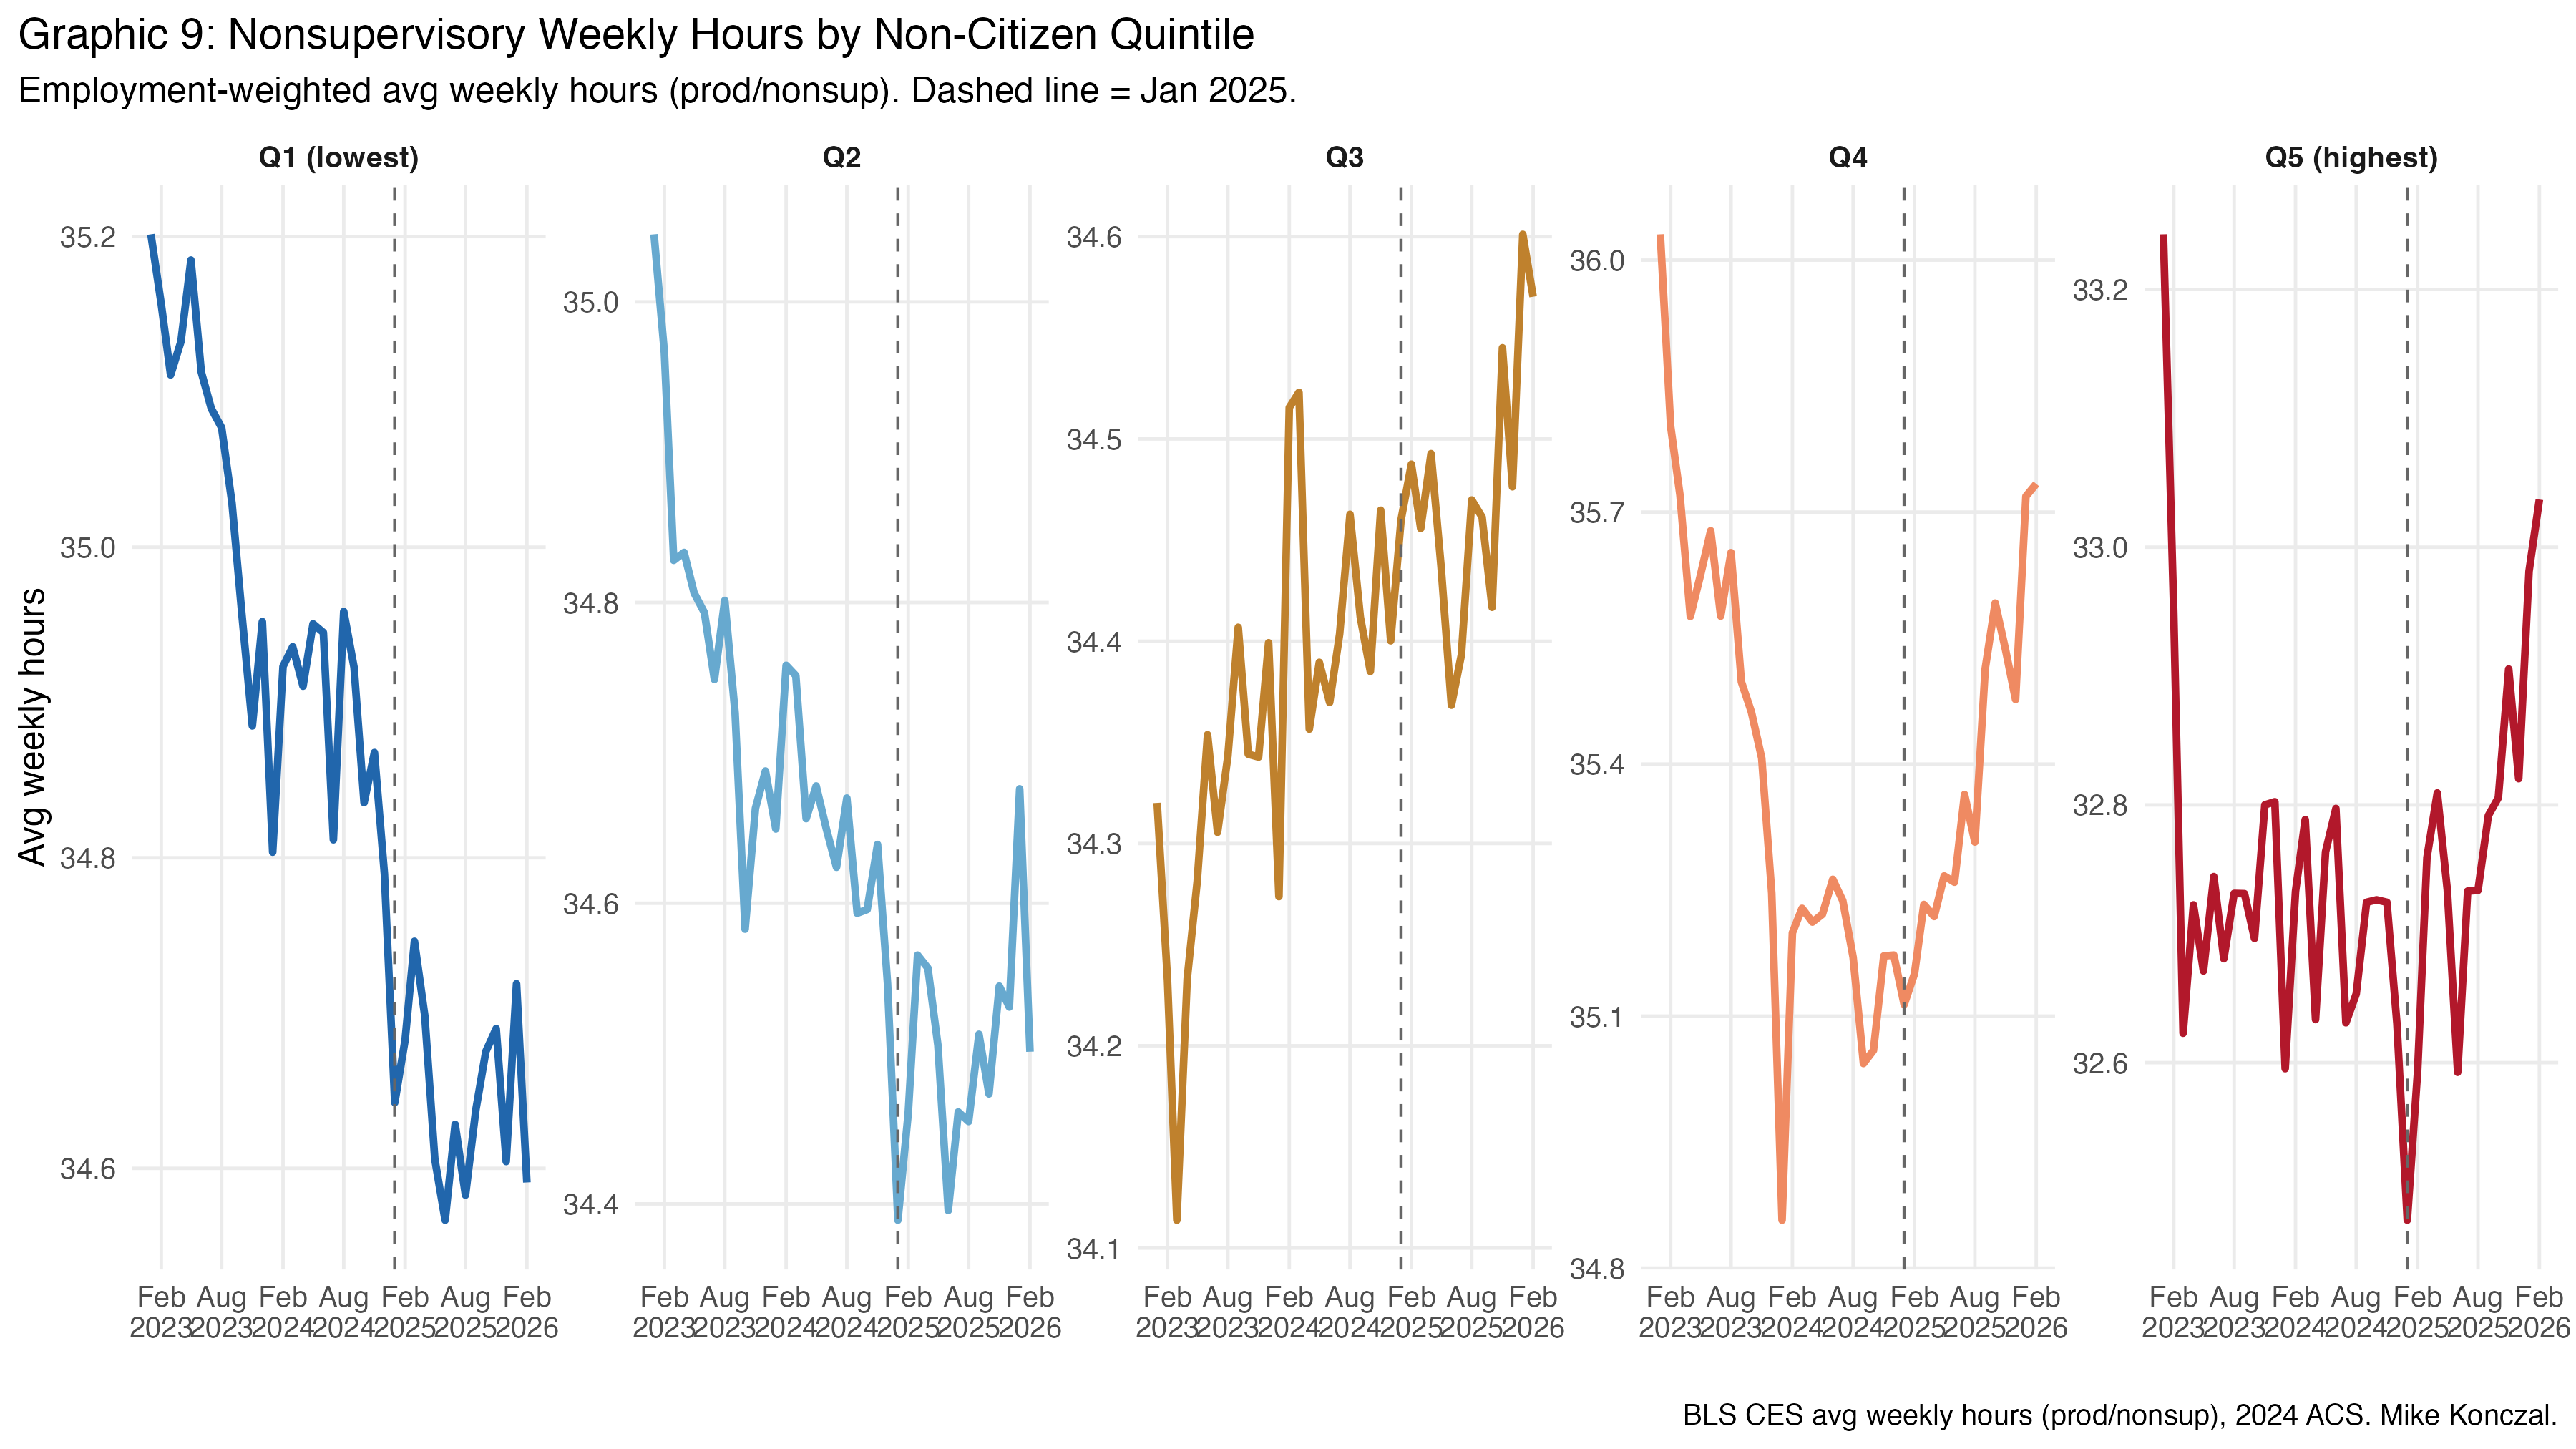
We see that hours are increasing for Q5. (They are flat or recently increasing if we look at all hours.) So not an obvious demand shock.
One story is that this is tariffs. Q4 and Q5 have a lot of workers in construction, durable goods, and transportation, all of which have had a major slowdown in job growth. Trying to estimate this versus cyclical measurements is difficult given the lack of actual aggregate slowdown in unemployment rates. But all of these workers are being impacted by the administration’s trade war.
Another more worrying possibility is that employers are using the threat of ICE to slow wages, even as hours increase, which would mean the enforcement regime is bad even for the remaining workers. We’ll get more granular data in the years ahead, but consider this post a signal flare for all students of monopsony power looking for research topics.
The industries with the most non-citizen workers had the biggest job growth collapse, they’re now driving the rebound, and their wages are decelerating. The first fact is what the break-even papers predict. The second and third are harder to square with any simple story about labor supply. Something is happening to employer behavior in these industries, and it’s not the high-wage workforce the Trump administration promised.
The code for this post is accessible on Github here. As a new rule, each blog post is going to get its own repository, so it is easy for you to fork and try to tear this analysis apart so we can iterate and make it better. More, there’s going to be (and is for this one) a CLAUDE.md designed to intersect with your own AI to help it immediately understand the framework and get you both to ask your own interesting questions faster.
The full list is on this BLS webpage (search for “CES diffusion index series spreadsheet”). R users can access it via tidyusmacro::cesDiffusionIndex, a library I maintain.
Most of the jobs data for this level of detailed sub-industries is delayed one month, hence us using February data even though March job numbers came out.
This subset is used to calculate the “diffusion index,” or the percent of industries adding jobs in any month. Weirdly, it’s one of the few datasets that is very helpful that isn’t on the FRED website. It’s also hidden in the monthly releases.
Examples are easier. NAICS numbers are six-digit hierarchical code, where they start with the broad category with the first numbers and then narrow with more numbers consistent. So all construction starts with 23, construction of buildings all start with 236, and residential building construction is 2361. (We’re just focused on the four-digits of specificity.)
The monthly jobs numbers has all four digits. The Census, which gives us noncitizen numbers, has a mix. The algorithm tries to match at 4-digits, if it fails it tries to match at 3, and then at 2. e.g. Census has only 23 for NAICS information, so all the different four digit construction job categories end up there, since they all start with 23.
Very interesting work. To me, it is evidence that new immigration policies partially explain job growth decline in CES.
Horrific policy on its own. Also a blow to the supply-side of the labor market.
Thanks for posting!
Fascinating post and superb research. As you mention, it needs to be followed, particularly in any downturn. I'm reminded of the work of anthropologist Michael Kearney. He points out that even such things as border patrols function not so much to apprehend illegal migrants as to force them to accept low-paying jobs while not claiming benefits accorded to other laborers. He cited the example of migrant Mixtecs, who walk through the mountains in winter to find work and who, because of their work ethic, are desired by American employers. They don’t understand why the Migra (border patrol) seek to apprehend them, forcing them to work harder and faster before they are apprehended and forcing them to take whatever work at whatever wages they can. But, as Kearney indicates, that is exactly the point of the Migra; it is not intended to stop migrants from coming into the United States to work; rather it functions to discipline them to work harder and accept low wages