

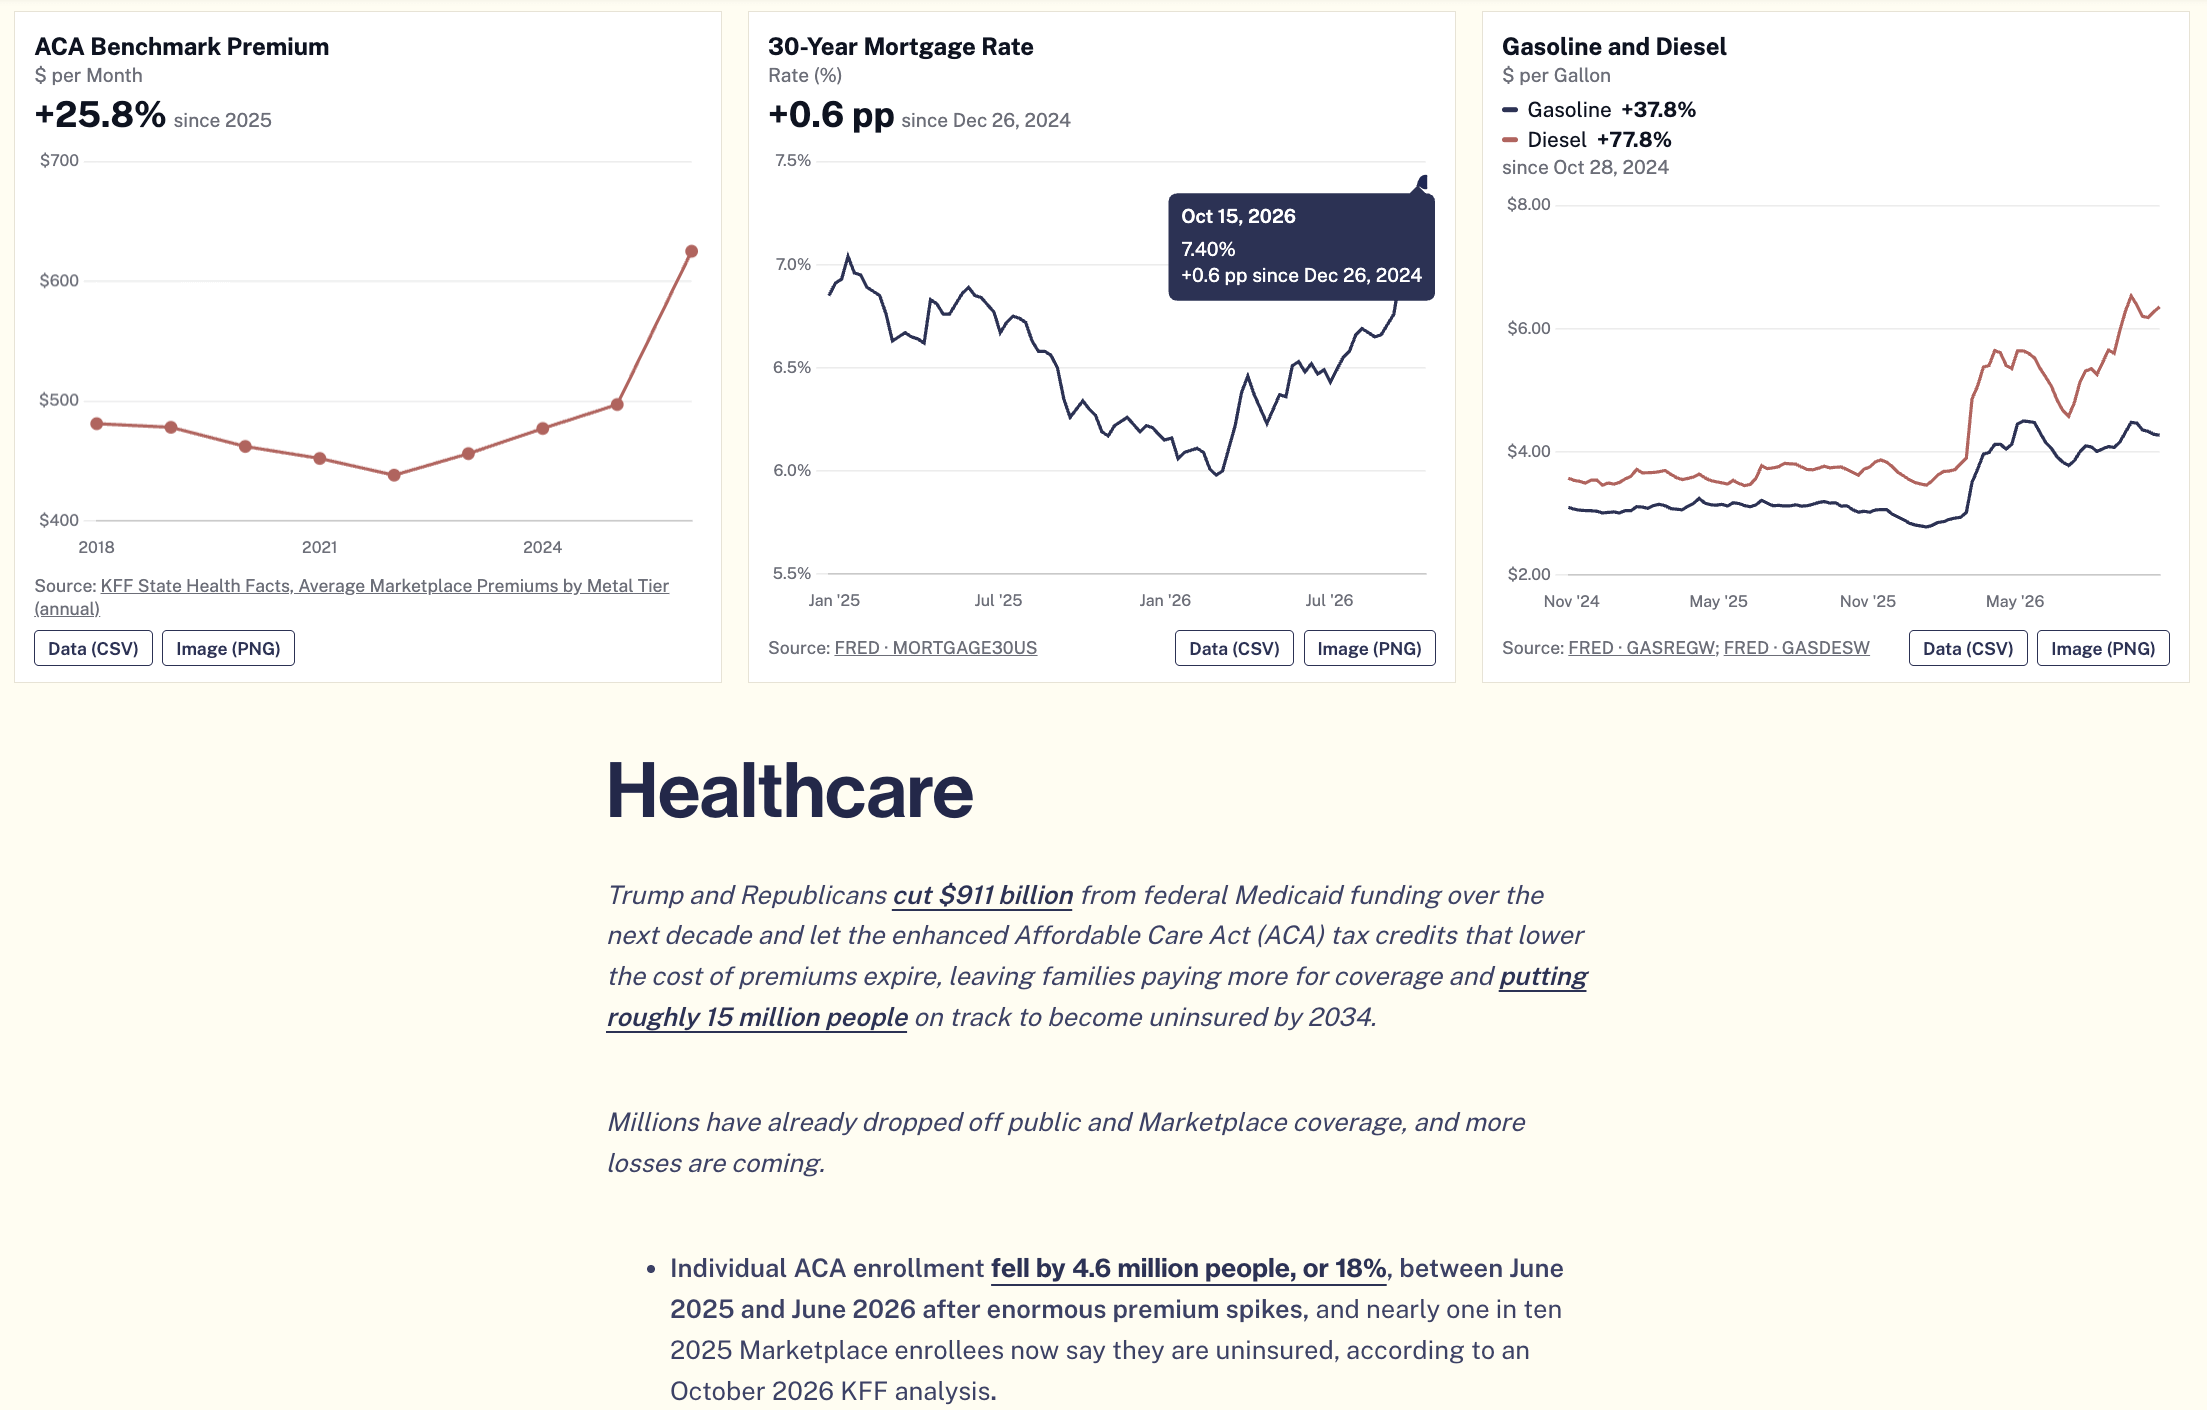
I’m excited to announce a new resource over at Economic Security Project Action: The Rising Cost of Trump’s Economy. Going into next week, I wanted to give a detailed guide on what’s gotten more unaffordable since Trump took office, based on specific actions the administration has taken. It covers healthcare, housing, energy, food, and care. If you’re writing about why voters are angry with the Trump administration over the economy, it brings together facts from our Affordability Dashboard and work by many of our friends and peer groups.
Affordability, Then and Now
When we started writing about affordability roughly one year ago (Becky Chao and I put out our Affordability Framework a year ago last week), I think there was a real push to just slap the label “affordability” on what we were already doing.
But we wanted to slow it down and take a more systematic approach, on the assumption that this would actually be here for a while. The counterargument then was that affordability is a terrible political priority because the price level won’t drop, and you’re getting people all angry about an $18 hamburger whose price can’t really fall outside a depression.
Our ESP listening tours and my read of both the survey and economic data back then made me think this reflected specific problems in sectors that make up much of the monthly budget, problems that Trump would make worse and that wouldn’t go away on their own. At ESP, we’ve been working through what a left-liberal affordability agenda would require in each of these sectors in our age of supply scarcity (as opposed to the previous decades of demand scarcity).
We did a deep dive on housing, laying out a left-YIMBYism that was already being put into motion in New York City, and is now at stake in the Los Angeles mayoral election. I’m also thrilled that we’ve brought on board Jacob Hacker and Gaby Aboulafia to do strategic healthcare work that will be out early next year. We have forthcoming work on how wages and social insurance can work together and are bringing on a long-term care fellow (apply!). It’s coming together.
Today’s healthcare numbers are a good example of why we’ve taken this sector-by-sector approach.
Health Insurance: It’s Bad
Doing all this work means I’m not on top of the data releases as much as I used to be. I remember that I spent a lot of time, a shocking amount of time, on the Employment Cost Index (ECI) in 2022 and 2023, but I almost missed today’s release, a few days before the midterms. And there’s a thing in there that’s just brutal.
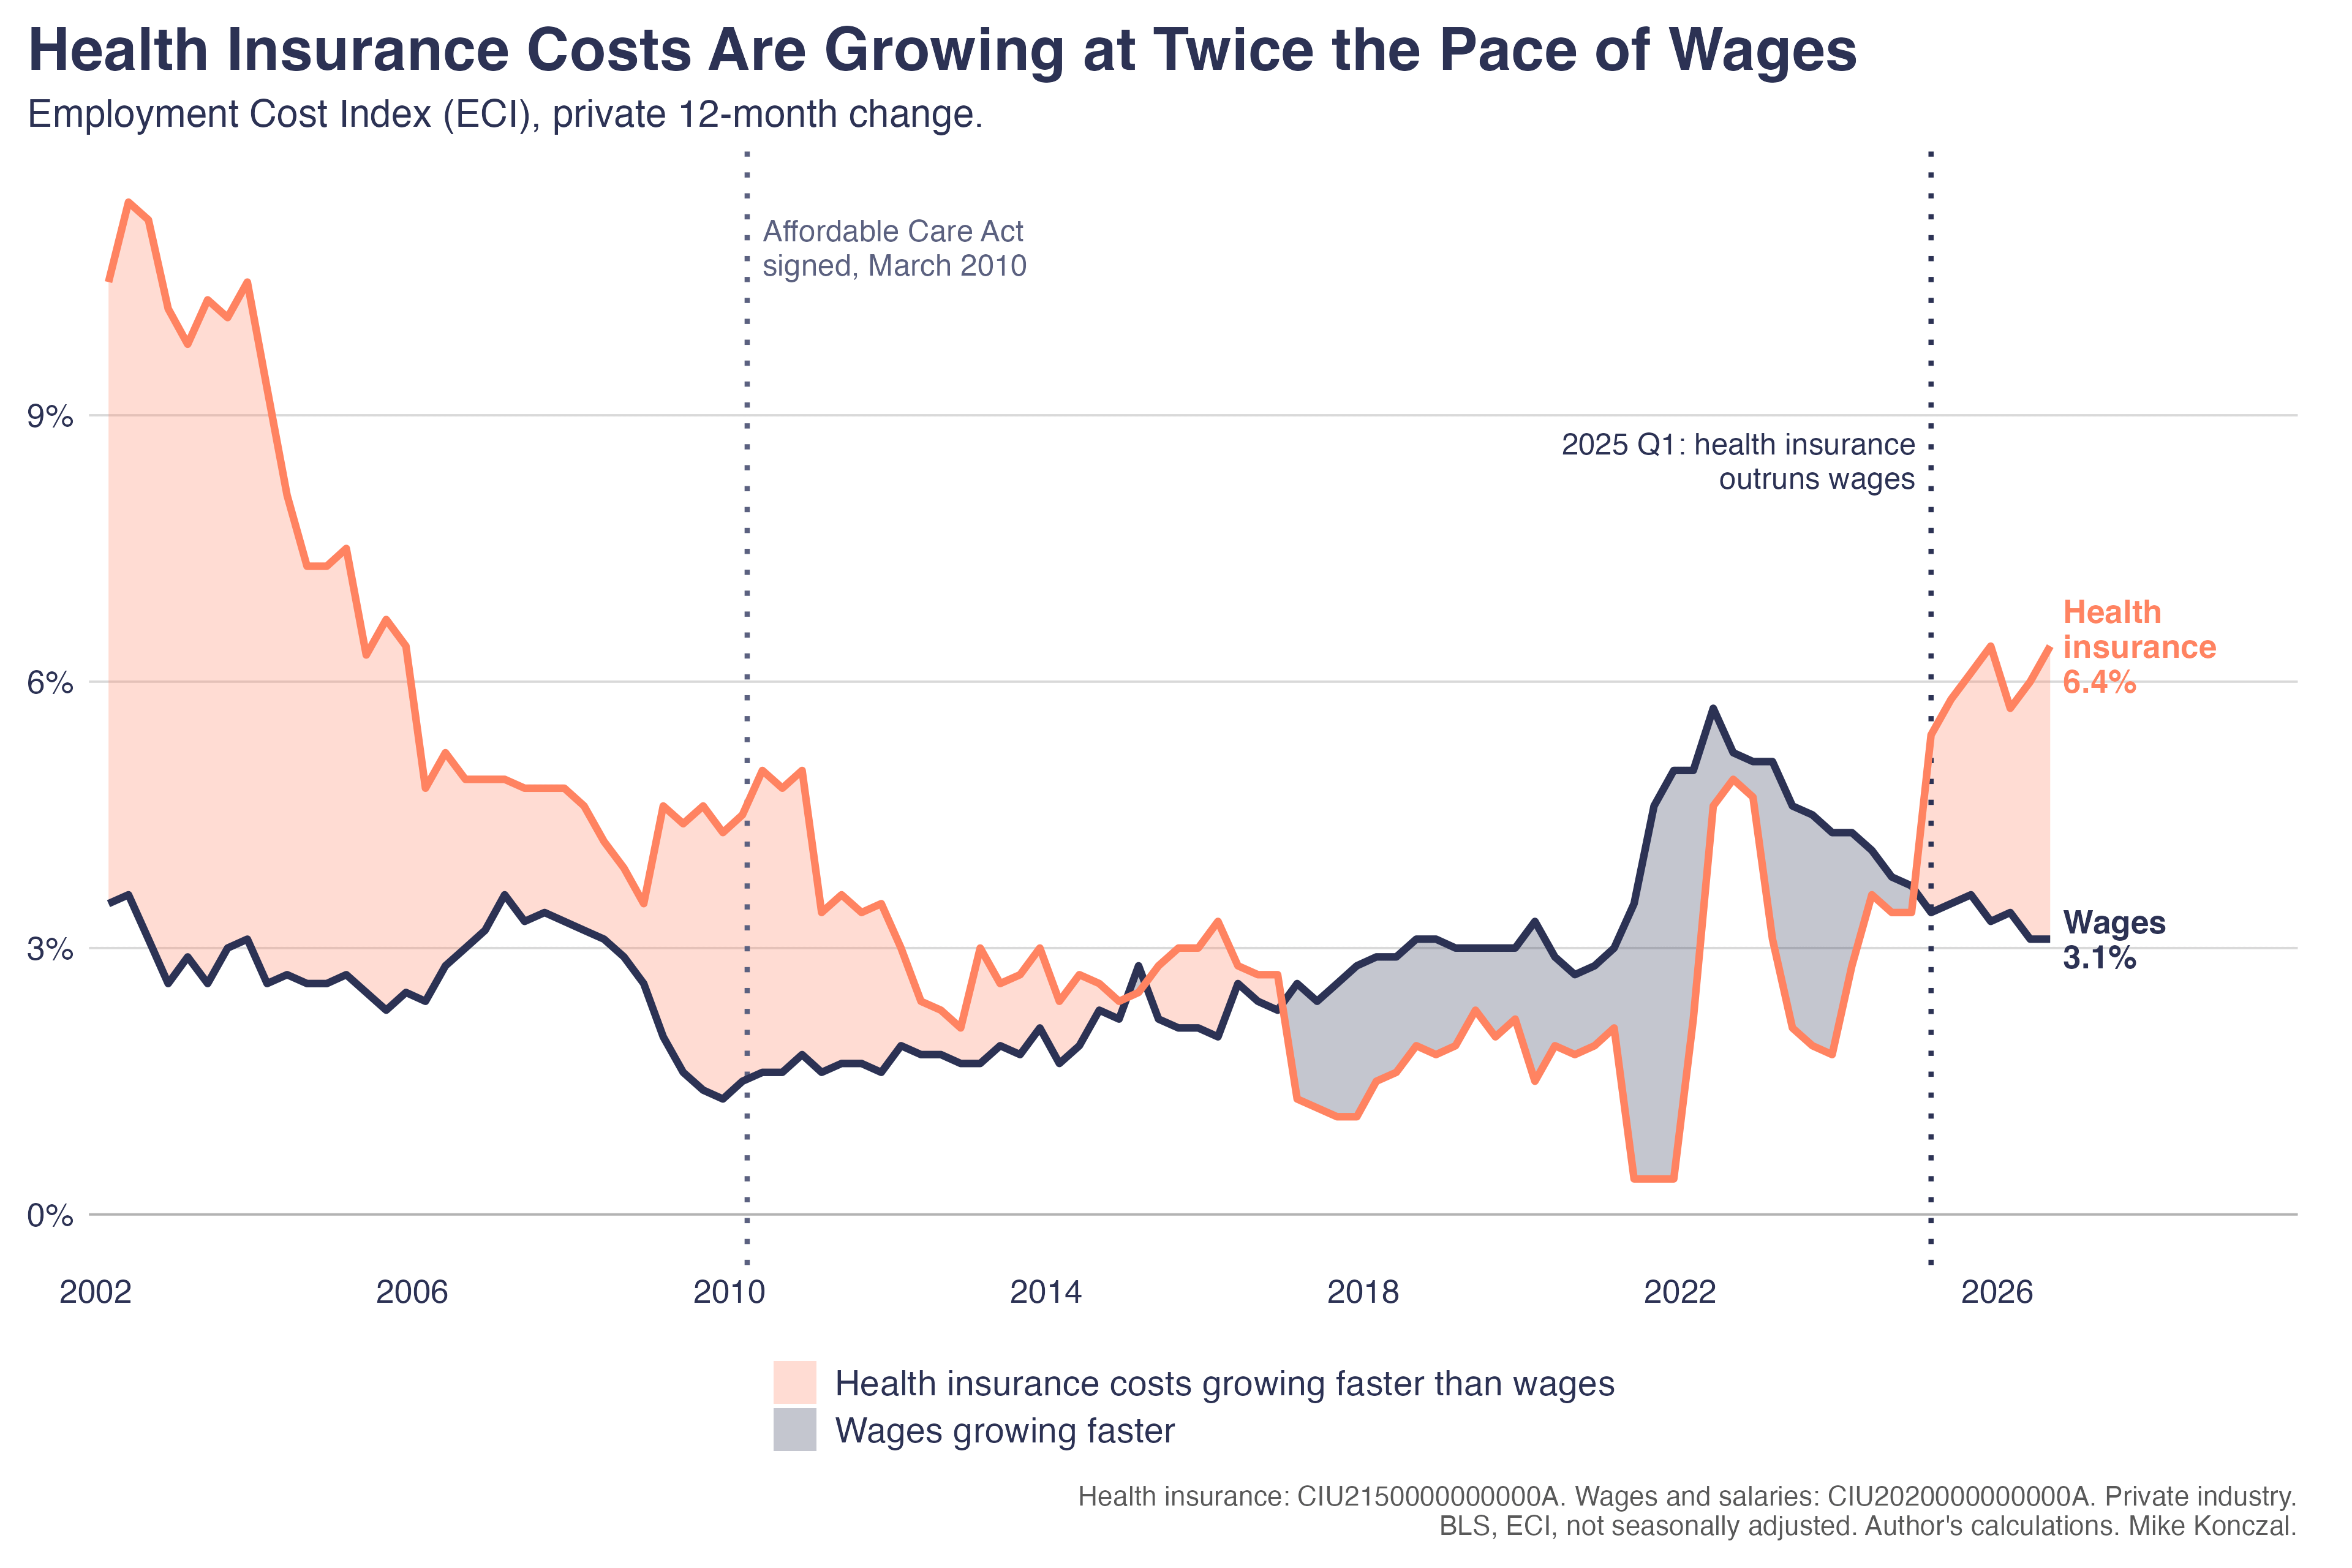
Here’s a graphic inspired by friend of the blog Guy Berger’s recap: wage growth versus health insurance cost growth. Notice this is a survey of employers: it measures their costs. Here’s how fast employers’ hourly costs for wages and health insurance have grown over the last 12 months.
And zoomed in:
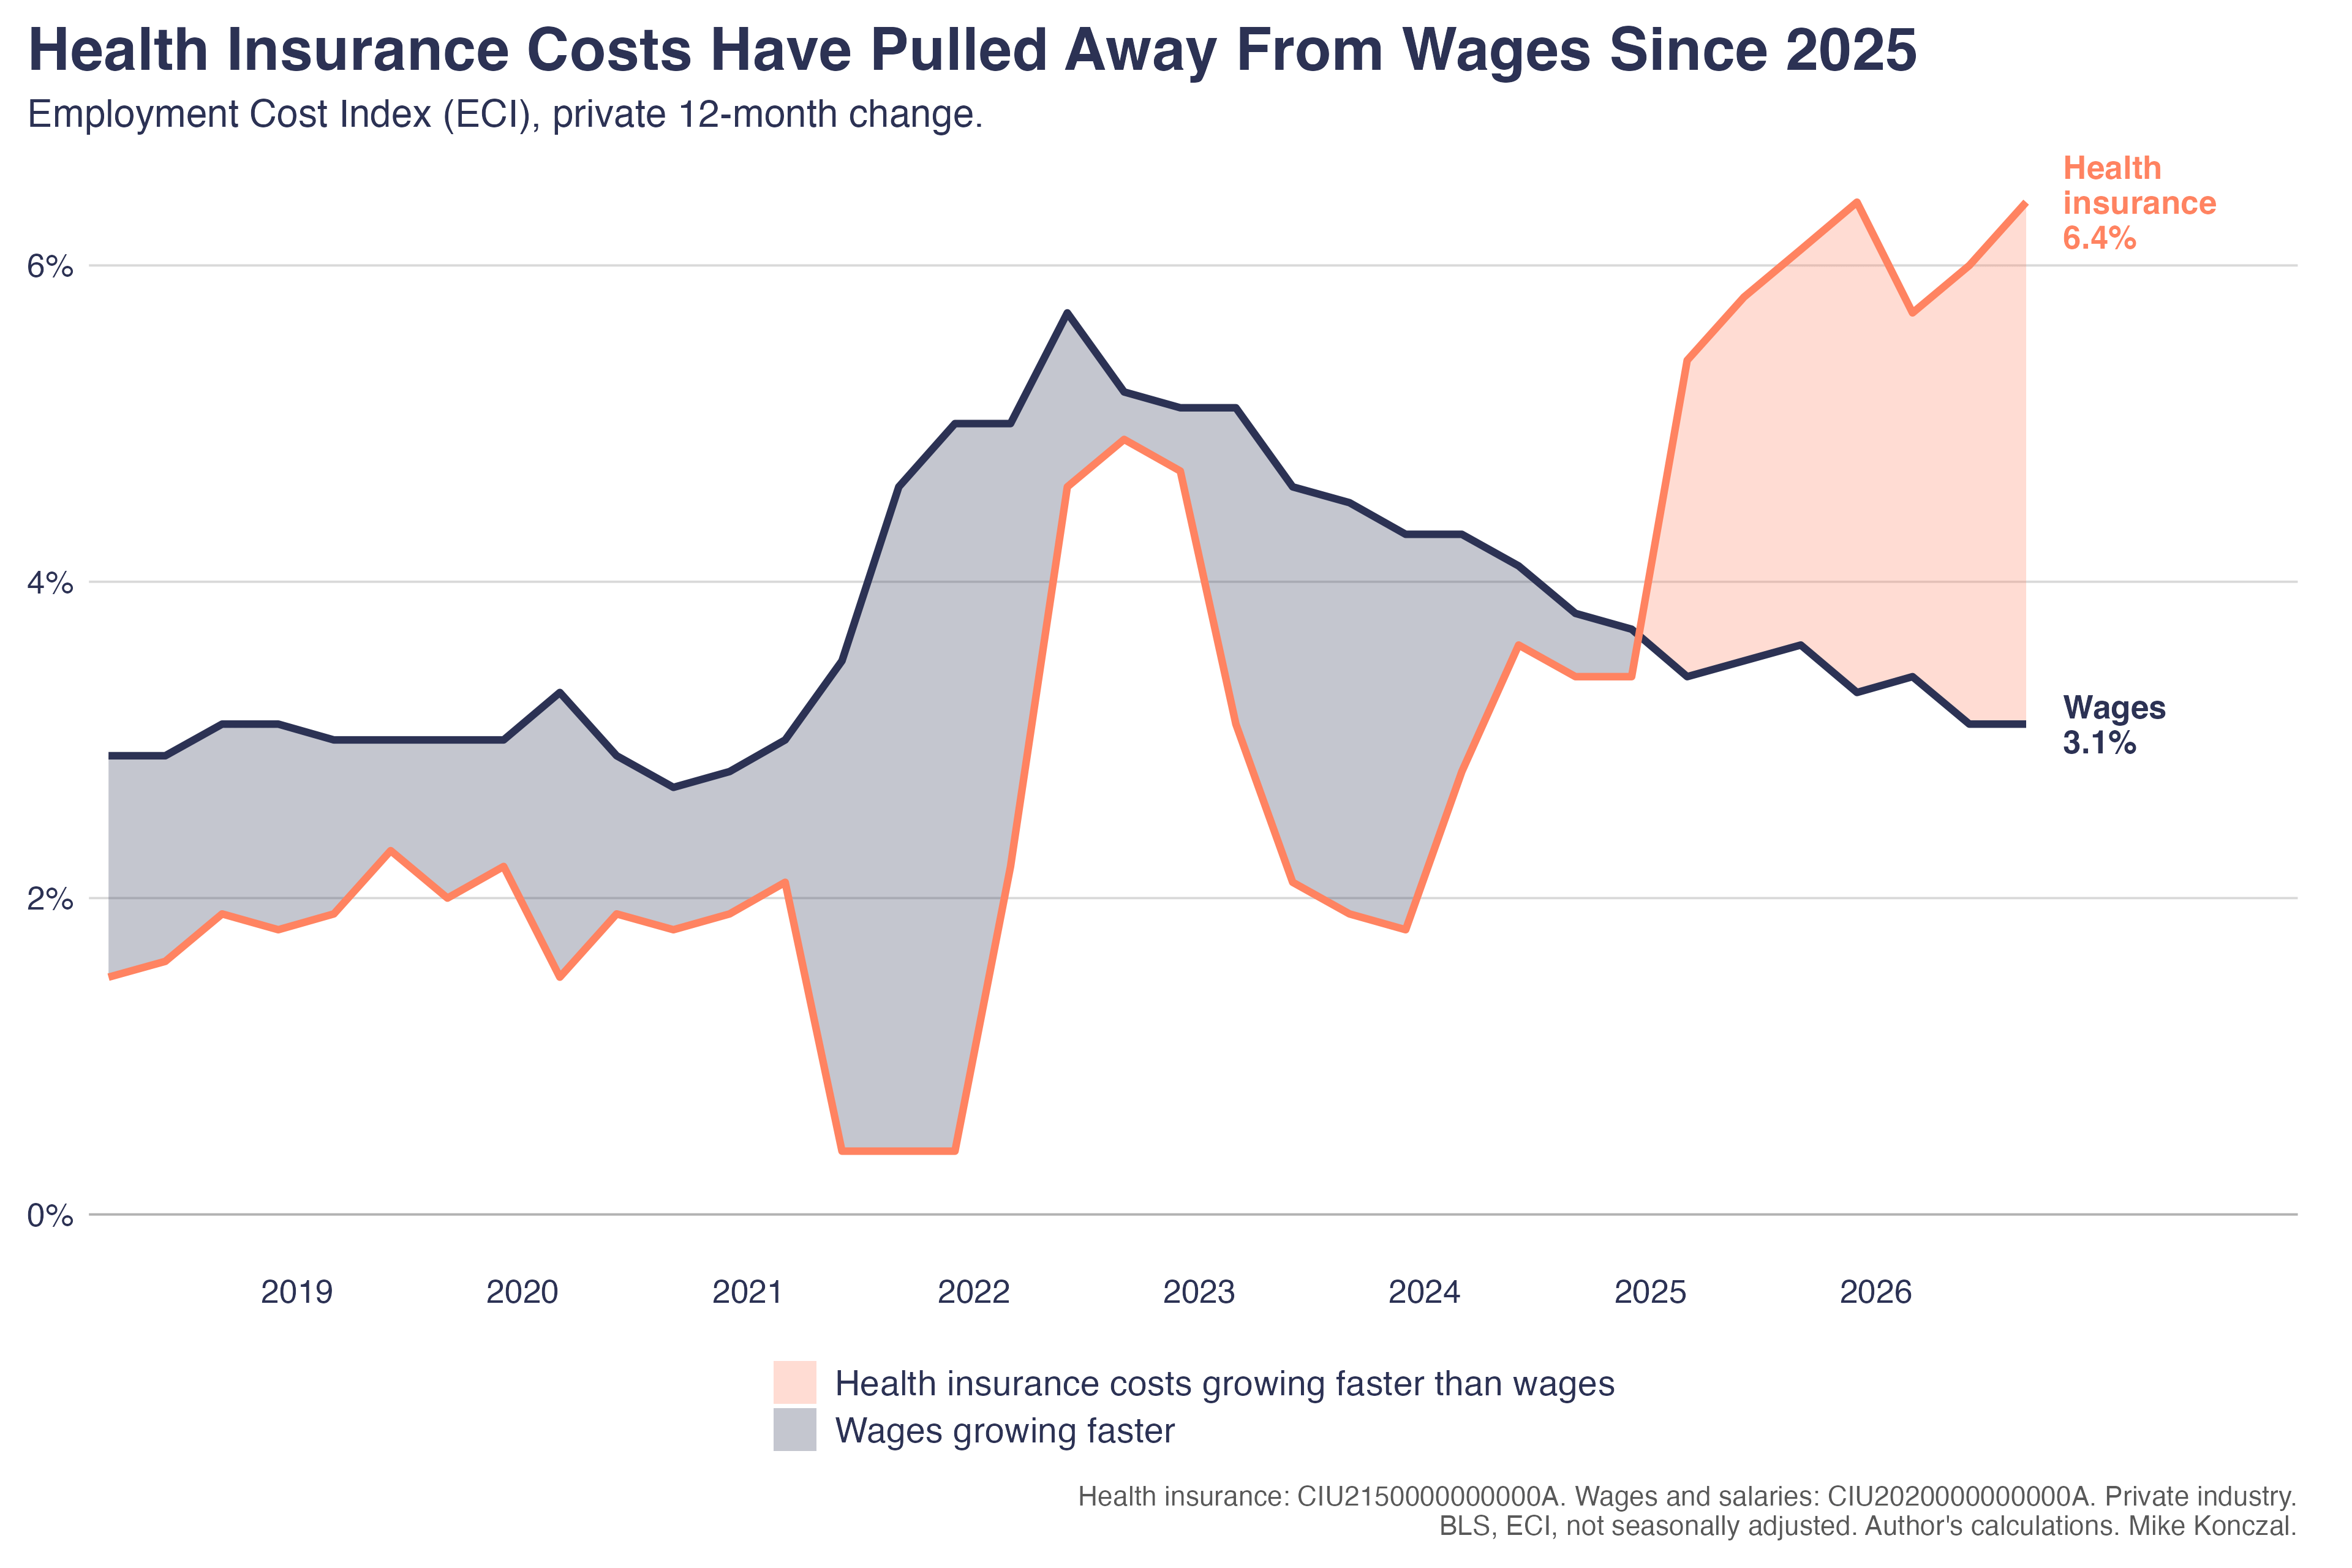
This is a trailing 12-month change, which is the only way the ECI breaks out health insurance. The ECI is an index, so it shows how fast costs are growing but not how many dollars are involved. For that, we can turn to the Employer Costs for Employee Compensation (ECEC), which gives dollar amounts per hour worked. It shows the share of total compensation, including wages and benefits, that employers spend on health insurance. That share has been skyrocketing after having fallen for a while: 7.4 percent in the second quarter of 2026 (the latest data), up from 6.7 percent at the end of 2024 and approaching its 2014 peak of 7.9 percent.
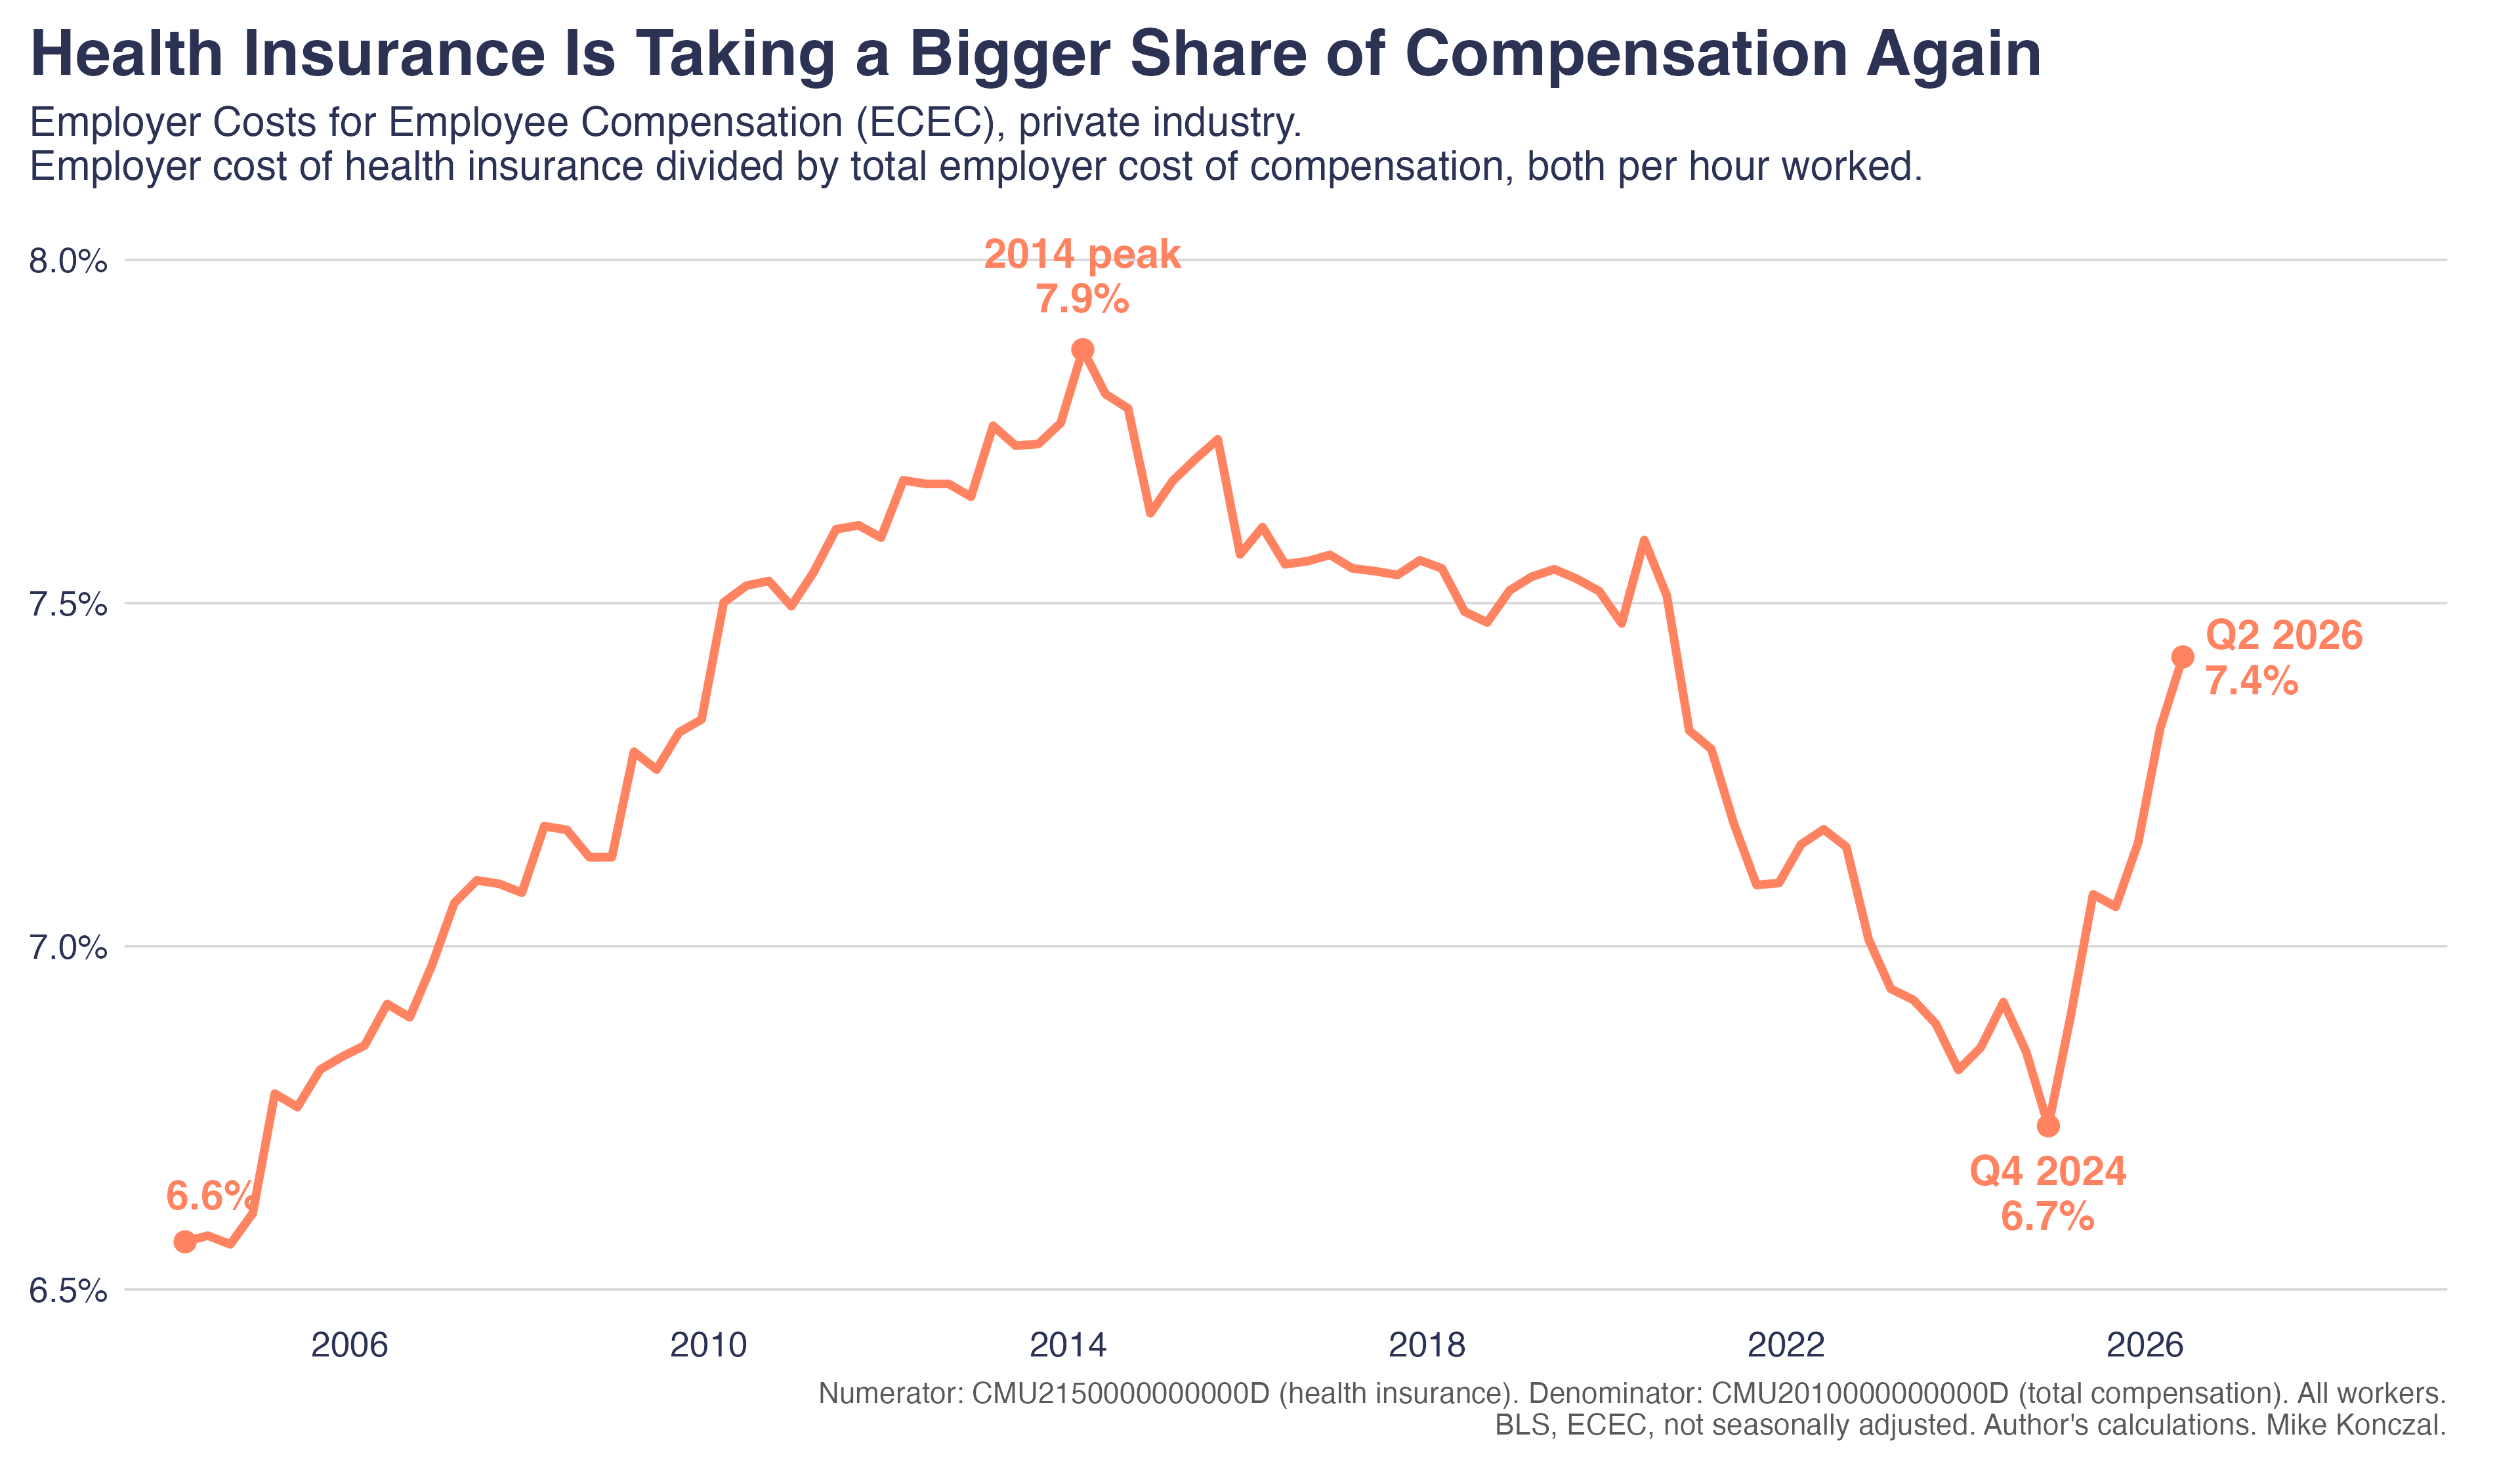
This is just what private employers spend on health insurance, but what ACA enrollees pay in premiums after subsidies is spiking, and enrollment in Medicaid and ACA plans has fallen by millions too.
The employer-cost figures also exclude employees’ own premium contributions and deductibles. They tell us nothing about prior authorizations or the miserable experience of navigating the system. Friend of the blog Rachel Cohen Booth at Vox has a nice write-up about how healthcare is coming to dominate the midterms. The timing is pretty perfect.
Healthcare costs are not a “hoax,” and they’re not displaced anxiety about the cost of hiring a taxi for your burrito. It’s a real, substantive challenge voters are demanding that policymakers address.
Is the cost data adjusted for benefit changes? If employer cost went up x%, is that after benefit reductions (eg, employer raised all deductibles by $xxx)? Similarly, does the data reflect employees changes in elections (eg, employee had to elect a lower valued plan with a higher deductible so they could have affordable payroll deductions)?
Employers' surging costs for employee health insurance will likely put a brake on wage increases, right? Wages already aren't keeping up with inflation; no wonder if employer costs are rising so precipitously.